Xormon 2.0 New Features
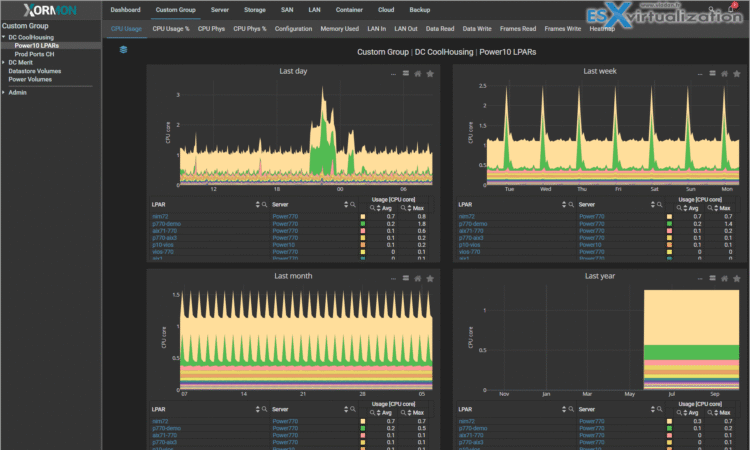
Xormon 2.0 represents a major milestone in infrastructure monitoring, introducing groundbreaking features alongside comprehensive platform support. This guide explores every new capability in detail.
Game-Changing Features
AI Agent
The standout feature of Xormon 2.0 is its integrated AI assistant, which transforms how administrators interact with monitoring data.
Key Capabilities:
- Natural Language Queries: Ask questions about your infrastructure in plain English
- Intelligent Insights: Get explanations about performance trends and anomalies
- Troubleshooting Assistance: Receive guided help for diagnosing issues
- Configuration Guidance: Get recommendations on optimal settings
Enhanced Monitoring Capabilities
Resource Configuration Advisor
A new intelligent tool that analyzes your infrastructure configuration and provides optimization recommendations.
Supported Platforms:
- IBM Power Systems
- VMware vSphere
- Proxmox VE
- Nutanix AHV
What It Does:
- Identifies overcommitted resources
- Detects underutilized systems
- Recommends right-sizing opportunities
- Suggests consolidation possibilities
- Calculates potential cost savings
Historical Reports
A lightweight, high-performance reporting engine that makes it easy to generate custom reports without performance impact.
Capabilities:
- Generate reports for any time period
- Export to multiple formats (PDF, CSV, Excel)
- Schedule automated report delivery
- Create custom templates
- Combine multiple metrics in single reports
Performance Benefits:
- Minimal system overhead
- Fast generation even for large datasets
- Real-time data aggregation
Server Monitoring Enhancements
IBM Power Systems
POWER11 and HMC 11 Support
Full support for IBM’s latest hardware and management console.
New Capabilities:
- POWER11 processor metrics
- HMC 11 API integration
- Enhanced LPAR monitoring
- Updated capacity analytics
LAN Topology Visualization
Comprehensive network topology mapping for IBM Power environments.
Features:
- SR-IOV (Single Root I/O Virtualization) configuration display
- VLAN mapping and visualization
- SEA (Shared Ethernet Adapter) relationships
- Link aggregation details
- Interactive topology diagrams
Enhanced CPU Shared Pool Graphs
Improved visualization and analysis of shared processor pools.
Improvements:
- More detailed utilization metrics
- Better trend analysis
- Pool-to-LPAR relationship clarity
- Performance comparison tools
CPU Workload Estimator
A powerful tool for capacity planning and workload analysis.
What It Does:
- Estimates CPU requirements for planned workloads
- Analyzes current utilization patterns
- Projects future capacity needs
- Helps with hardware upgrade decisions
- Calculates shared pool optimization
Virtual Ethernet Performance
Enhanced network performance tracking for virtual adapters.
New Metrics:
- Virtual Ethernet now included in Total graphs
- VLAN performance under each LPAR
- VIO adapter statistics
- Throughput and error tracking
VMware vSphere
vCenter 9.x Support
Full compatibility with VMware’s latest vCenter release.
Active Snapshot Monitoring
Revolutionary visibility into VM snapshots that helps prevent storage disasters.
Features:
- Complete list of all active snapshots across your environment
- Individual snapshot sizes and growth rates
- Creation dates and age tracking
- VM-specific snapshot history
- Disk space consumption graphs
- Snapshot chain depth visualization
vSAN Monitoring
Comprehensive monitoring for VMware’s software-defined storage.
Metrics Tracked:
- Cluster capacity and utilization
- Disk group performance
- Network throughput
- Resync operations
- Component health
- Cache hit ratios
SAN Hardware Topology
Visual mapping of your VMware storage infrastructure.
Displays:
- ESXi host to SAN switch connections
- Multipath configurations
- HBA to switch port mappings
- Path redundancy visualization
- Bandwidth utilization per path
Proxmox VE
OS Agent Data Mapping
Integration of OS-level metrics directly into VM monitoring.
Benefits:
- Unified view of hypervisor and guest metrics
- CPU, memory, disk, and network data in consolidated tabs
- Correlation between host and guest performance
- Simplified troubleshooting workflow
Consolidated Tabs for VMs
Streamlined interface organization improves navigation efficiency.
Improvements:
- All VM metrics grouped into logical sub-tabs
- Reduced main menu clutter
- Faster access to specific metrics
- More intuitive interface layout
Storage Monitoring Enhancements
New Storage Platform Support
Qumulo
Full monitoring support for Qumulo’s scale-out NAS platform.
Monitored Metrics:
- Cluster capacity and performance
- File system operations
- Network throughput
- Node-level statistics
Scality RING
Comprehensive monitoring for Scality’s object storage platform.
Features:
- Object storage capacity tracking
- Performance metrics
- Data distribution visualization
- Health monitoring
Hitachi HNAS
Support for Hitachi NAS Platform monitoring.
Capabilities:
- File system performance
- Network throughput
- Storage pool utilization
- Client connection statistics
Microsoft Storage Spaces Direct (S2D)
Native monitoring for Microsoft’s hyper-converged infrastructure.
Metrics:
- Storage pool health
- Virtual disk performance
- Cache effectiveness
- Resiliency status
IBM FlashSystem 900/840
Extended support for older FlashSystem models.
Enhanced Storage Features
Dell EMC PowerMAX
New Capabilities:
- Interactive topology diagrams showing host-to-storage relationships
- Real-time alerts and events dashboard
- Host to Storage Group mapping visualization
- Effective Total and Used Capacity metrics (Unisphere V10+)
IBM FlashSystem
Policy-Based Replication (PBR) Support:
- Visual representation of replication policies
- Policy-based high availability (PBHA) monitoring
- Replication status and health tracking
- New subsystems: Host Cluster and Volume Groups
Dell EMC PowerScale/Isilon
- Added spare capacity tracking (VHS) for storage pools
- Enhanced capacity planning capabilities
Hitachi VSP
- Automatic grouping of port data into Host Groups
- Simplified navigation of large storage arrays
Pure Storage
- REST API 2.0 support
- Port statistics (Ethernet and Fibre Channel)
- Volume Group monitoring
- Protection Group tracking
Network Monitoring Enhancements
LAN Monitoring
Network Topology Visualization
Interactive topology maps for LAN infrastructure.
Features:
- Automatic discovery of switch interconnections
- Device relationship mapping
- Port-level connectivity details
- Visual identification of network segments
New Metrics
Discards In/Out:
- Track packet drops on interfaces
- Identify potential congestion points
- Troubleshoot quality of service issues
SFP Power Graphs:
- Monitor optical transceiver power levels
- Detect failing or degraded SFP modules
- Preventive maintenance for fiber connections
- Track signal quality over time
Interswitch Link (ISL) Graphs
Comprehensive view of switch-to-switch connectivity.
Features:
- Aggregate ISL graphs from all switches
- Bandwidth utilization tracking
- Error rate monitoring
- Traffic flow visualization
SAN/LAN Universal Enhancements
Dual Metric Display
All network graphs now show data in both formats simultaneously.
Options:
- Bytes/sec: Traditional byte-based measurements
- Bits/sec: Network engineer-friendly format
- Toggle between views instantly
- Compare across different metric types
Switch Uptime Tracking
Monitor switch availability and stability.
Benefits:
- Track unplanned reboots
- Identify unstable devices
- Correlate performance issues with uptime
- Maintenance scheduling insights
Total Errors Graph (SAN)
Aggregated error tracking across all SAN switches.
Shows:
- CRC errors
- Link failures
- Frame errors
- Aggregate error trends
Final Thought
Xormon 2.0 sets a strong foundation for future enhancements. The investment in AI capabilities, REST API expansion, and modern architecture positions Xormon as a forward-thinking monitoring platform capable of evolving with your infrastructure needs.
Whether you’re managing VMware environments, IBM Power Systems, multi-vendor storage arrays, or complex hybrid infrastructures, Xormon 2.0 provides the comprehensive monitoring capabilities needed to maintain performance, prevent issues, and plan for growth.
Additional Resources
- Official Release Notes
- Demo Environment (login: xormon/xormon)
- Download Xormon 2.0
- Installation Documentation
- Community Forum
- Video Tutorials
