Checkmate: Your Open-Source Infrastructure Monitoring Solution
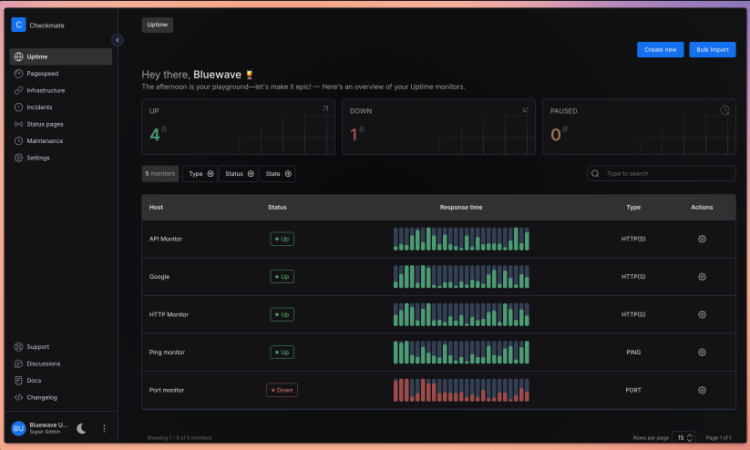
Checkmate is a comprehensive monitoring platform designed to track and monitor server hardware, uptime, response times, and incidents in real-time. Built with beautiful visualizations and a user-friendly interface, it provides everything you need to keep your infrastructure running smoothly.
Unlike proprietary monitoring solutions that charge per monitor or lock you into monthly subscriptions, Checkmate gives you complete control. You can deploy it on your own servers, customize it to your needs, and monitor unlimited endpoints without worrying about escalating costs.
Why Choose Checkmate?
Complete Control and Privacy
As a self-hosted solution, Checkmate ensures your monitoring data stays within your infrastructure. You’re not sending sensitive information about your servers, response times, or incidents to third-party services. This is particularly important for organizations with strict data sovereignty or compliance requirements.
Cost-Effective Monitoring at Scale
The project has been stress-tested with over 1,000 active monitors without performance issues. The memory footprint is impressively small—a Node.js instance monitoring 323 servers every minute consumes minimal resources, making it suitable even for resource-constrained environments like Raspberry Pi devices.
Rich Feature Set
Checkmate offers an extensive array of monitoring capabilities:
- Website Monitoring: Track uptime and availability of your web properties
- Page Speed Monitoring: Monitor performance metrics to ensure optimal user experience
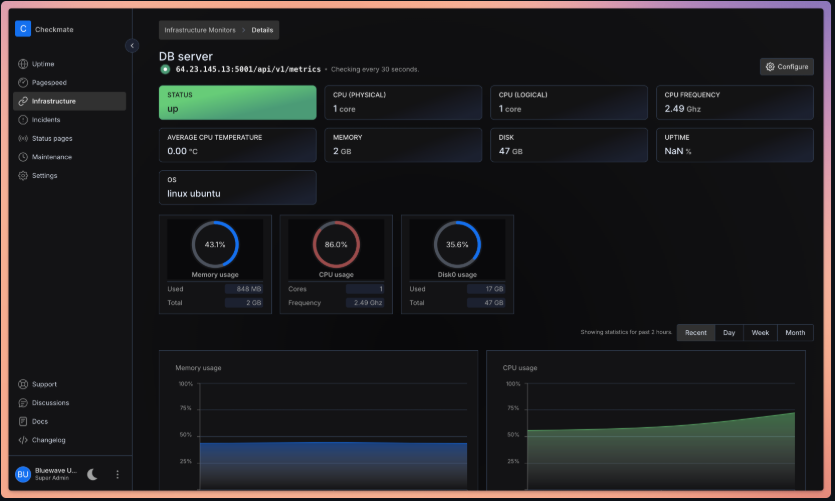
- Infrastructure Monitoring: Keep tabs on memory, disk usage, CPU performance, and network statistics (requires the Capture agent)
- Docker Monitoring: Track containerized applications and services
- Ping Monitoring: Basic connectivity checks for any networked device
- SSL Monitoring: Get alerts before certificates expire
- Port Monitoring: Ensure critical services are accessible
- Game Server Monitoring: Specialized monitoring for gaming infrastructure
- JSON Query Monitoring: Validate API responses and data integrity
Beautiful, Intuitive Interface
Built with React and Material-UI (MUI), Checkmate delivers a modern, responsive interface that makes complex monitoring data easy to understand. Real-time visualizations powered by Recharts help you spot trends and issues at a glance.
Comprehensive Alerting
Stay informed through multiple notification channels:
- Email notifications
- Webhooks for custom integrations
- Discord alerts
- Slack notifications
Status Pages
Create public or private status pages to keep stakeholders informed about your infrastructure’s health. This transparency builds trust with customers and streamlines communication during incidents.
Multi-Language Support
Checkmate supports multiple languages including English, German, Japanese, Portuguese (Brazil), Russian, Turkish, Ukrainian, Vietnamese, and Chinese (Traditional, Taiwan), making it accessible to global teams.
Technical Architecture
Checkmate leverages modern, battle-tested technologies:
- Frontend: React with Material-UI framework
- Backend: Node.js for efficient, scalable monitoring operations
- Database: MongoDB for flexible data storage
- Visualization: Recharts for stunning, responsive charts
- License: AGPL-3.0 (open source)
The architecture is designed for performance and reliability. The team has successfully demonstrated monitoring 1,000+ active monitors without bottlenecks, and the memory usage remains remarkably efficient even under heavy load.
The Capture Agent
For advanced infrastructure monitoring, Checkmate works seamlessly with Capture, a lightweight agent that collects detailed metrics from your servers:
- CPU utilization and load
- Memory usage and availability
- Disk space and I/O statistics
- Temperature monitoring
- Network statistics
Capture is cross-platform, running on Linux, Windows, macOS, Raspberry Pi, and any device that supports Go. While Checkmate works perfectly fine for website and service monitoring without Capture, the agent unlocks the full potential of infrastructure monitoring.
Getting Started with Checkmate
Ready to take control of your monitoring? Here’s everything you need to know to get Checkmate up and running.
Installation and Configuration Guide
Prerequisites
Before installing Checkmate, ensure you have the following:
- Docker and Docker Compose (recommended method)
- Docker version 20.10 or higher
- Docker Compose version 2.0 or higher
- Server Requirements
- 2 GB RAM minimum (4 GB recommended for production)
- 10 GB disk space
- Linux, macOS, or Windows with Docker support
- Network Requirements
- Outbound internet access (for monitoring external websites)
- Open ports for web interface (default: 5000)
Installation Methods
Checkmate offers several installation options to suit different deployment scenarios.
Method 1: Docker Compose (Recommended)
Docker Compose is the easiest and most reliable way to get Checkmate running. This method handles all dependencies automatically.
Step 1: Clone the Repository
bash
# Clone the Checkmate repository
git clone https://github.com/bluewave-labs/Checkmate.git

# Navigate to the project directory
cd Checkmate
Step 2: Configure Environment Variables
Create a .env file in the root directory:
bash
# Copy the example environment file
cp .env.example .env

# Edit the .env file with your preferred text editor
nano .env
Essential environment variables to configure:
env
# Application Settings
NODE_ENV=production
PORT=5000

# MongoDB Configuration
DB_TYPE=MongoDB
DB_CONNECTION_STRING=mongodb://mongodb:27017/checkmate

# Redis Configuration
REDIS_HOST=redis
REDIS_PORT=6379

# JWT Secret (generate a secure random string)
JWT_SECRET=your-super-secure-random-string-here

# Client URL (your domain or IP)
CLIENT_HOST=http://your-domain.com:5000

# Admin Account (first-time setup)
ADMIN_EMAIL=admin@yourdomain.com
ADMIN_PASSWORD=your-secure-password

# Email Configuration (for notifications)
SMTP_HOST=smtp.gmail.com
SMTP_PORT=587
SMTP_USER=your-email@gmail.com
SMTP_PASSWORD=your-app-password

# System Email (sender address)
SYSTEM_EMAIL_HOST=smtp.gmail.com
SYSTEM_EMAIL_PORT=587
SYSTEM_EMAIL_ADDRESS=noreply@yourdomain.com
SYSTEM_EMAIL_PASSWORD=your-app-password
Step 3: Start Checkmate
bash
# Start all services with Docker Compose
docker-compose up -d

# Verify all containers are running
docker-compose ps
Expected output:
NAME                COMMAND                  SERVICE             STATUS
checkmate-client    "docker-entrypoint.s…"   client              Up
checkmate-server    "docker-entrypoint.s…"   server              Up
checkmate-mongodb   "docker-entrypoint.s…"   mongodb             Up
checkmate-redis     "docker-entrypoint.s…"   redis               Up
Step 4: Access the Dashboard
Open your web browser and navigate to:
http://localhost:5000Or if you configured a domain:
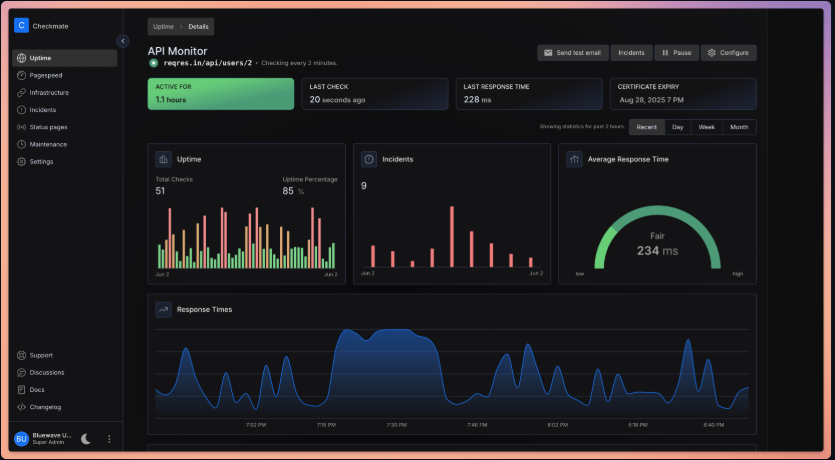
http://your-domain.com:5000Log in with the admin credentials you set in the .env file.
Method 2: Kubernetes Deployment
For production environments requiring high availability, Checkmate supports Kubernetes deployment.
Step 1: Install Helm
bash
# Install Helm if not already installed
curl https://raw.githubusercontent.com/helm/helm/main/scripts/get-helm-3 | bash
Step 2: Configure Helm Values
Download the Helm chart values file:
bash
# Navigate to the Helm chart directory
cd charts/helm/checkmate

# Copy and edit the values file
cp values.yaml custom-values.yaml
nano custom-values.yaml
Key configurations in custom-values.yaml:
yaml
# Application image
image:
  repository: bluewavelab/checkmate
  tag: latest
  pullPolicy: IfNotPresent

# Resource allocation
resources:
  limits:
    cpu: 2000m
    memory: 2Gi
  requests:
    cpu: 500m
    memory: 512Mi

# Ingress configuration
ingress:
  enabled: true
  className: nginx
  hosts:
    - host: checkmate.yourdomain.com
      paths:
        - path: /
          pathType: Prefix
  tls:
    - secretName: checkmate-tls
      hosts:
        - checkmate.yourdomain.com

# MongoDB configuration
mongodb:
  enabled: true
  auth:
    enabled: true
    rootPassword: "your-mongodb-root-password"
    database: checkmate

# Redis configuration
redis:
  enabled: true
  auth:
    enabled: true
    password: "your-redis-password"
Step 3: Install the Helm Chart
bash
# Create namespace
kubectl create namespace checkmate

# Install Checkmate
helm install checkmate . \
  --namespace checkmate \
  --values custom-values.yaml

# Verify deployment
kubectl get pods -n checkmate
Step 4: Access via Ingress
Once all pods are running, access Checkmate through your configured domain:
https://checkmate.yourdomain.com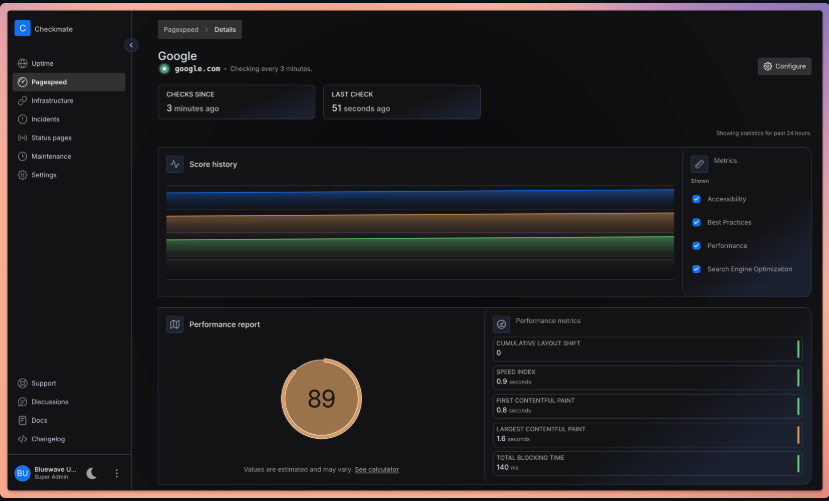
Method 3: Manual Installation
For advanced users who want full control over each component.
Step 1: Install Dependencies
bash
# Update system packages
sudo apt update && sudo apt upgrade -y

# Install Node.js (v18 or higher)
curl -fsSL https://deb.nodesource.com/setup_18.x | sudo -E bash -
sudo apt install -y nodejs

# Install MongoDB
wget -qO - https://www.mongodb.org/static/pgp/server-6.0.asc | sudo apt-key add -
echo "deb [ arch=amd64,arm64 ] https://repo.mongodb.org/apt/ubuntu focal/mongodb-org/6.0 multiverse" | sudo tee /etc/apt/sources.list.d/mongodb-org-6.0.list
sudo apt update
sudo apt install -y mongodb-org

# Start MongoDB
sudo systemctl start mongod
sudo systemctl enable mongod

# Install Redis
sudo apt install -y redis-server

# Start Redis
sudo systemctl start redis-server
sudo systemctl enable redis-server
Step 2: Clone and Build
bash
# Clone repository
git clone https://github.com/bluewave-labs/Checkmate.git
cd Checkmate

# Install server dependencies
cd server
npm install
npm run build

# Install client dependencies
cd ../client
npm install
npm run build
Step 3: Configure Application
Create server configuration file:
bash
cd server
nano .env
Add configuration:
env
NODE_ENV=production
PORT=5000
DB_CONNECTION_STRING=mongodb://localhost:27017/checkmate
REDIS_HOST=localhost
REDIS_PORT=6379
JWT_SECRET=your-jwt-secret
CLIENT_HOST=http://localhost:3000
Step 4: Start Services
bash
# Start the server
cd server
npm run start

# In a new terminal, start the client
cd client
npm run start
Post-Installation Configuration
1. Create Your First Monitor
After logging in:
- Navigate to Monitors from the sidebar
- Click + Create Monitor
- Select monitor type (HTTP, Ping, Port, etc.)
- Configure monitor settings:
- Name: Descriptive name for the monitor
- URL/Host: Target to monitor
- Check Interval: How often to check (minimum 1 minute)
- Request Timeout: Maximum time to wait for response
- Click Create to activate the monitor
2. Configure Notifications
Set up alerts to stay informed:
- Go to Settings > Notifications
- Add notification channels:
Email Notifications:
- SMTP Host: smtp.gmail.com
- SMTP Port: 587
- Username: your-email@gmail.com
- Password: your-app-password
- From Address: noreply@yourdomain.com
Slack Integration:
- Webhook URL: https://hooks.slack.com/services/YOUR/WEBHOOK/URL
- Channel: #monitoring
Discord Integration:
- Webhook URL: https://discord.com/api/webhooks/YOUR/WEBHOOK/URL- Test each notification channel to verify configuration
3. Set Up Status Pages
Create public status pages for transparency:
- Navigate to Status Pages
- Click Create Status Page
- Configure page settings:
- Page Name: Your service name
- Description: Brief description of monitored services
- Monitors: Select which monitors to display
- Visibility: Public or Private
- Customize appearance and branding
- Copy the public URL to share with stakeholders
4. Configure Maintenance Windows
Schedule maintenance to prevent false alerts:
- Go to Maintenance section
- Click Schedule Maintenance
- Set maintenance details:
- Title: Maintenance description
- Start Time: When maintenance begins
- Duration: How long it will last
- Affected Monitors: Select monitors to pause
- Save the maintenance window
Installing the Capture Agent
For advanced infrastructure monitoring, install Capture on your servers:
On Linux
bash
# Download Capture
wget https://github.com/bluewave-labs/capture/releases/latest/download/capture-linux-amd64

# Make executable
chmod +x capture-linux-amd64

# Move to system path
sudo mv capture-linux-amd64 /usr/local/bin/capture

# Create configuration file
sudo mkdir -p /etc/capture
sudo nano /etc/capture/config.yaml
Add configuration:
yaml
server_url: http://your-checkmate-server:5000
api_key: your-api-key-from-checkmate
hostname: server-01
collection_interval: 60s

metrics:
  - cpu
  - memory
  - disk
  - network
  - temperature
Create systemd service:
bash
sudo nano /etc/systemd/system/capture.serviceini
[Unit]
Description=Capture Monitoring Agent
After=network.target

[Service]
Type=simple
User=root
ExecStart=/usr/local/bin/capture -config /etc/capture/config.yaml
Restart=always
RestartSec=10

[Install]
WantedBy=multi-user.target
Start the service:
bash
sudo systemctl daemon-reload
sudo systemctl start capture
sudo systemctl enable capture
sudo systemctl status capture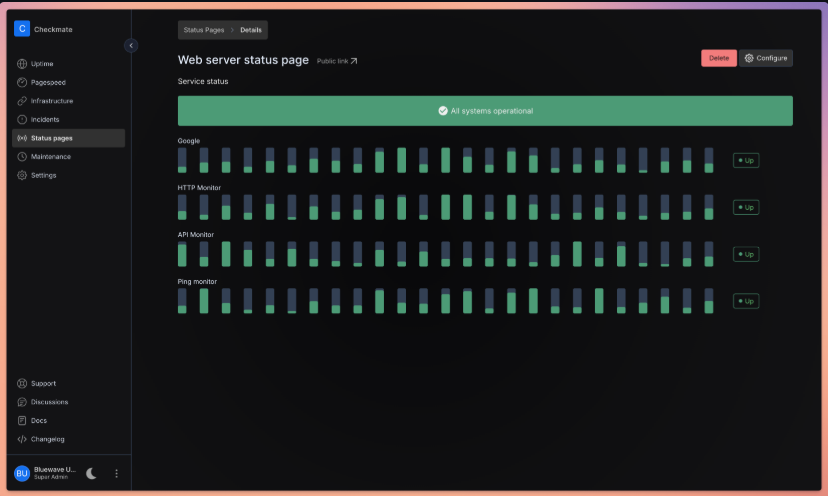
On Windows
- Download
capture-windows-amd64.exefrom releases - Create
config.yamlin the same directory - Run as Administrator:
capture-windows-amd64.exe -config config.yamlTo run as a Windows service, use NSSM:
nssm install Capture "C:\path\to\capture-windows-amd64.exe" "-config C:\path\to\config.yaml"
nssm start Capture
Security Best Practices
1. Use HTTPS
Configure reverse proxy with SSL:
Nginx Configuration:
nginx
server {
    listen 443 ssl http2;
    server_name checkmate.yourdomain.com;

    ssl_certificate /etc/letsencrypt/live/checkmate.yourdomain.com/fullchain.pem;
    ssl_certificate_key /etc/letsencrypt/live/checkmate.yourdomain.com/privkey.pem;

    location / {
        proxy_pass http://localhost:5000;
        proxy_set_header Host $host;
        proxy_set_header X-Real-IP $remote_addr;
        proxy_set_header X-Forwarded-For $proxy_add_x_forwarded_for;
        proxy_set_header X-Forwarded-Proto $scheme;
    }
}
2. Secure MongoDB
bash
# Connect to MongoDB
mongosh

# Create admin user
use admin
db.createUser({
  user: "admin",
  pwd: "strong-password-here",
  roles: [ { role: "root", db: "admin" } ]
})

# Create Checkmate user
use checkmate
db.createUser({
  user: "checkmate",
  pwd: "another-strong-password",
  roles: [ { role: "readWrite", db: "checkmate" } ]
})

# Enable authentication
# Edit /etc/mongod.conf
security:
  authorization: enabled
Update connection string in .env:
DB_CONNECTION_STRING=mongodb://checkmate:password@localhost:27017/checkmate?authSource=checkmate3. Firewall Rules
bash
# Allow only necessary ports
sudo ufw allow 22/tcp     # SSH
sudo ufw allow 80/tcp     # HTTP
sudo ufw allow 443/tcp    # HTTPS
sudo ufw enable
4. Regular Backups
bash
# Create backup script
nano /usr/local/bin/checkmate-backup.sh
bash
#!/bin/bash
BACKUP_DIR="/backups/checkmate"
DATE=$(date +%Y%m%d_%H%M%S)

# Backup MongoDB
mongodump --out=$BACKUP_DIR/mongodb_$DATE --gzip

# Backup configuration
cp -r /path/to/checkmate/.env $BACKUP_DIR/config_$DATE/

# Compress and keep only last 30 days
find $BACKUP_DIR -type f -mtime +30 -delete

echo "Backup completed: $DATE"
bash
# Make executable
chmod +x /usr/local/bin/checkmate-backup.sh

# Add to crontab (daily at 2 AM)
crontab -e
0 2 * * * /usr/local/bin/checkmate-backup.sh
Troubleshooting Common Issues
Issue 1: Cannot Access Web Interface
Solution:
bash
# Check if containers are running
docker-compose ps

# Check logs
docker-compose logs -f server
docker-compose logs -f client

# Restart services
docker-compose restart
Issue 2: Monitors Not Running
Solution:
bash
# Check server logs for errors
docker-compose logs server | grep ERROR

# Verify MongoDB connection
docker-compose exec mongodb mongosh --eval "db.adminCommand('ping')"

# Verify Redis connection
docker-compose exec redis redis-cli ping
Issue 3: Email Notifications Not Working
Solution:
- Verify SMTP credentials in
.env - Check if app password is required (Gmail, Outlook)
- Test SMTP connection:
bash
docker-compose exec server node -e "
const nodemailer = require('nodemailer');
const transport = nodemailer.createTransport({
  host: process.env.SMTP_HOST,
  port: process.env.SMTP_PORT,
  auth: {
    user: process.env.SMTP_USER,
    pass: process.env.SMTP_PASSWORD
  }
});
transport.verify().then(console.log).catch(console.error);
"
Issue 4: High Memory Usage
Solution:
- Check number of active monitors
- Reduce check intervals for less critical monitors
- Increase server resources if monitoring 500+ endpoints
- Enable MongoDB query optimization:
javascript
// Create indexes in MongoDB
db.checks.createIndex({ monitorId: 1, createdAt: -1 })
db.monitors.createIndex({ userId: 1, isActive: 1 })
Upgrading Checkmate
Docker Compose Upgrade
bash
# Backup data first
./checkmate-backup.sh

# Pull latest images
docker-compose pull

# Restart with new images
docker-compose up -d

# Verify upgrade
docker-compose logs -f
Manual Upgrade
bash
# Backup current installation
cp -r Checkmate Checkmate.backup

# Pull latest changes
cd Checkmate
git pull origin main

# Update dependencies
cd server && npm install
cd ../client && npm install

# Rebuild
npm run build

# Restart services
pm2 restart checkmate-server
pm2 restart checkmate-client
Performance Optimization Tips
- Enable Redis Caching: Already configured by default in Docker
- Adjust Check Intervals: Use 5-minute intervals for non-critical monitors
- Implement Retention Policies:
javascript
// Delete checks older than 90 days
db.checks.deleteMany({
  createdAt: { $lt: new Date(Date.now() - 90 * 24 * 60 * 60 * 1000) }
})- Use Capture Agent Wisely: Monitor only essential metrics
- Optimize Database: Run regular maintenance
bash
docker-compose exec mongodb mongosh checkmate --eval "db.runCommand({ compact: 'checks' })"Conclusion
Checkmate represents a new paradigm in infrastructure monitoring—one where you’re not locked into expensive subscriptions or forced to compromise on features. With its rich feature set, beautiful interface, and active open-source community, Checkmate delivers enterprise-grade monitoring capabilities that you can deploy, customize, and scale according to your needs.
Whether you’re a startup looking to monitor a handful of services, a growing business managing dozens of servers, or an enterprise requiring comprehensive infrastructure visibility, Checkmate scales with you. The self-hosted nature ensures your monitoring data remains private, while the open-source model means you can customize every aspect to fit your workflow.
Click here to read more about Checkmate
