Are you ready to dive into the world of time-series data and start harnessing its power? In this step-by-step guide, we will walk you how to install InfluxDB in Ubuntu. Whether you are a seasoned developer or a newbie, this article will provide you with everything you need to know to get started.
Why Use InfluxDB for Time-Series Data?
InfluxDB is a powerful open-source time-series database that is known for its impressive scalability and performance. Time-series data is data that is measured and recorded over time, such as sensor data, financial market data, or IoT device data. Traditional databases are not optimized for handling this type of data efficiently, which is where InfluxDB shines.
With InfluxDB, you can efficiently store, analyze, and visualize time-series data. It offers a simplified data model, making it easy to organize and query your data. InfluxDB also provides high-performance writes and queries, allowing you to handle large volumes of data with ease. Whether you are working on a small personal project or a large-scale enterprise application, InfluxDB is a great choice for managing your time-series data.
System Requirements for Installing InfluxDB
Before we dive into the installation process, let’s take a quick look at the system requirements for installing InfluxDB. The requirements may vary slightly depending on the operating system you are using, but here are the general guidelines:
- Operating System: InfluxDB supports Windows, Linux, and macOS.
- CPU: A modern multi-core processor is recommended for optimal performance.
- Memory: InfluxDB’s memory requirements depend on the amount of data you will be storing and querying. As a general rule of thumb, allocate at least 2GB of memory for smaller deployments and scale up as needed.
- Disk Space: InfluxDB requires disk space for storing your data. The amount of disk space needed will depend on the size of your dataset. Allocate sufficient disk space to accommodate your data growth.
- Network: InfluxDB requires network connectivity to allow clients to connect and interact with the database.
Now that you have an idea of the system requirements, let’s move on to the installation steps for InfluxDB on different operating systems.
Installation Steps for InfluxDB on Different Operating Systems
Windows
Installing InfluxDB on Windows is a straightforward process. Here are the steps:
- Download InfluxDB: Visit the InfluxDB downloads page and download the Windows installer (
.msifile). - Run the Installer: Double-click the downloaded
.msifile to launch the installer. - Accept the License Agreement: Read and accept the license agreement to proceed with the installation.
- Choose Installation Path: Select the installation path for InfluxDB. The default path is usually fine, but you can choose a different location if desired.
- Start the Installation: Click the “Install” button to start the installation process.
- Complete the Installation: Once the installation is complete, click the “Finish” button to exit the installer.
Congratulations! You have successfully installed InfluxDB on Windows. Let’s move on to the next operating system.
Linux
Installing InfluxDB on Linux is slightly different from Windows. Here are the steps:
- Add the InfluxData Repository: Open a terminal and run the following command to add the InfluxData repository to your package manager:
shell echo "deb https://repos.influxdata.com/ubuntu bionic stable" | sudo tee /etc/apt/sources.list.d/influxdb.list
- Import the Repository Key: Run the following command to import the repository key:
shell curl -sL https://repos.influxdata.com/influxdb.key | sudo apt-key add -
- Update and Install InfluxDB: Update your package manager and install InfluxDB by running the following commands:
shell sudo apt-get update sudo apt-get install influxdb
This will install InfluxDB and start the service automatically.
- Verify the Installation: To verify the installation, run the following command to check the InfluxDB version:
shell influxd version
If everything is set up correctly, you should see the version number printed in the terminal.
Great! InfluxDB is now installed on your Linux machine. Let’s move on to the last operating system.
macOS
Installing InfluxDB on macOS is similar to Linux, but with a few differences. Here are the steps:
- Add the InfluxData Repository: Open a terminal and run the following command to add the InfluxData repository to Homebrew:
shell brew update brew install influxdb
- Start the InfluxDB Service: Run the following command to start the InfluxDB service:
shell brew services start influxdb
- Verify the Installation: To verify the installation, run the following command to check the InfluxDB version:
shell influxd version
If everything is set up correctly, you should see the version number printed in the terminal.
Congratulations! InfluxDB is now installed on your macOS machine.
Verifying the Installation and Checking the InfluxDB Version
After successfully installing InfluxDB, it is important to verify the installation and check the version to ensure everything is working as expected. Here are the steps to do that:
- Open a Terminal or Command Prompt: Open a terminal or command prompt, depending on your operating system.
- Start the InfluxDB Service: Start the InfluxDB service by running the appropriate command for your operating system. For example:
- Windows: Open the InfluxDB Command Prompt from the Start menu.
- Linux: Run the following command:
shell sudo service influxdb start- macOS: Run the following command:
shell brew services start influxdb- Check the InfluxDB Version: Run the following command to check the InfluxDB version:
shell influxd version
If everything is set up correctly, you should see the version number printed in the terminal.
Awesome! You have successfully verified the installation and checked the InfluxDB version. Now let’s move on to the next step: configuring InfluxDB for optimal performance.
Configuring InfluxDB for Optimal Performance
To ensure optimal performance, it is important to configure InfluxDB with the right settings. Here are some key configurations you should consider:
- Open the InfluxDB Configuration File: Locate the InfluxDB configuration file on your system. The file is usually named
influxdb.confand can be found in the InfluxDB installation directory. - Adjust the Cache Size: In the configuration file, look for the
cache-max-memory-sizesetting and adjust it based on the amount of available memory on your system. This setting determines the maximum amount of memory allocated for caching data. - Enable Compression: Enable compression by uncommenting the
compress-enabledsetting in the configuration file. Compression can significantly reduce the disk space required for storing your data. - Configure Retention Policies: InfluxDB allows you to define retention policies to automatically expire or downsample data over time. Consider setting up appropriate retention policies based on your data retention requirements.
Once you have made the necessary configuration changes, save the file and restart the InfluxDB service to apply the changes.
Using the InfluxDB Command Line Interface (CLI)
The InfluxDB Command Line Interface (CLI) allows you to interact with your InfluxDB instance from the command line. It provides a set of commands that you can use to manage your databases, write data, query data, and perform various administrative tasks.
To start using the InfluxDB CLI, open a terminal or command prompt and run the following command:
shell influx
This will launch the InfluxDB CLI and connect to your local InfluxDB instance. From here, you can start executing commands to interact with your databases.
Let’s explore some common CLI commands:
- Creating a Database: To create a new database, use the following command:
shell CREATE DATABASE database_name>
- Writing Data: To write data to a database, use the following command:
shell INSERT INTO measurement_name> field_name>=field_value>
- Querying Data: To query data from a database, use the following command:
shell SELECT field_name> FROM measurement_name>
- Managing Databases: To list, delete, or show information about databases, use the following commands:
shell SHOW DATABASES DROP DATABASE database_name> SHOW RETENTION POLICIES ON database_name>
These are just a few examples of the commands you can use with the InfluxDB CLI. Refer to the InfluxDB documentation for a comprehensive list of available commands and their usage.
Creating a Database and Writing Data to InfluxDB
Now that you are familiar with the InfluxDB CLI, let’s create a database and write some data to it. Here are the steps:
- Open the InfluxDB CLI: Open a terminal or command prompt and run the following command to launch the InfluxDB CLI:
shell influx
- Create a Database: Run the following command to create a new database:
shell CREATE DATABASE mydatabase
Replace mydatabase with the desired name for your database.
- Switch to the Database: Switch to the newly created database by running the following command:
shell USE mydatabase
- Write Data: Write some sample data to the database using the following command:
shell INSERT INTO mymeasurement value=42
Replace mymeasurement with the desired name for your measurement, and value with the field name.
Congratulations! You have successfully created a database and written data to InfluxDB. Let’s move on to the next step: querying and retrieving data.
Querying and Retrieving Data from InfluxDB
InfluxDB provides a powerful query language called InfluxQL, which allows you to query and retrieve data from your databases. InfluxQL is similar to SQL but tailored specifically for time-series data.
Here’s an example of how to query data from InfluxDB:
shell SELECT * FROM mymeasurement WHERE time > now() - 1h
This query retrieves all data points from the mymeasurement measurement where the timestamp is within the last hour.
InfluxQL supports a wide range of functions and operators that you can use to filter, aggregate, and transform your data. Refer to the InfluxDB documentation for a comprehensive guide on using InfluxQL.
Visualizing Data with InfluxDB and Grafana
InfluxDB is a powerful database for storing and querying time-series data, but to truly unlock its potential, you need a way to visualize your data. That’s where Grafana comes in.
Grafana is an open-source platform for creating beautiful and interactive dashboards. It integrates seamlessly with InfluxDB, allowing you to easily visualize your time-series data.
To get started with Grafana, follow these steps:
- Install Grafana: Visit the Grafana website and download the appropriate installer for your operating system. Run the installer and follow the on-screen instructions to complete the installation.
- Configure InfluxDB as a Data Source: Open the Grafana web interface and configure InfluxDB as a data source. Provide the necessary connection details, such as the InfluxDB URL and credentials.
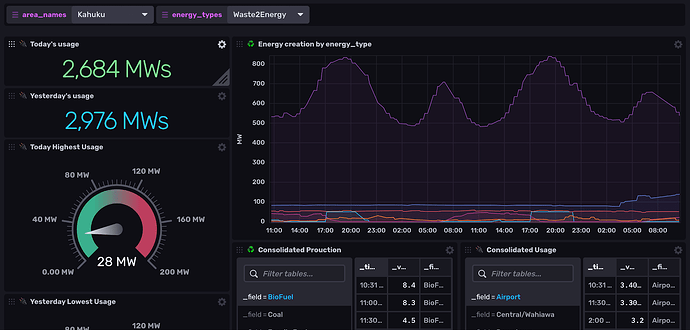
- Create a Dashboard: Once the data source is configured, you can create a new dashboard and start adding panels to visualize your data. Grafana provides a wide range of visualization options, including graphs, tables, gauges, and more.
With Grafana, you can build custom dashboards that display real-time data, historical trends, and other key metrics. It’s a powerful tool for monitoring and analyzing time-series data.
Conclusion
In this comprehensive guide, we have walked you through the process of installing InfluxDB using commands and screenshots. We covered the system requirements, installation steps for different operating systems, verifying the installation, configuring InfluxDB for optimal performance, using the InfluxDB CLI, creating databases and writing data, querying and retrieving data, and visualizing data with InfluxDB and Grafana.
Now it’s time for you to take what you’ve learned and start harnessing the power of time-series data with InfluxDB. Whether you are building IoT applications, monitoring infrastructure, or analyzing financial data, InfluxDB has you covered. So get your command line ready and unleash the full potential of time-series data with InfluxDB today!


