How to install Xormon 2.0

Introduction
Xormon 2.0 is a powerful enterprise monitoring solution that provides comprehensive infrastructure performance monitoring and capacity planning capabilities. Whether you’re managing virtual environments, storage systems, or network devices, proper installation is crucial for optimal performance. This guide walks you through the complete installation process based on hands-on deployment experience and official documentation.
What is Xormon 2.0?
Xormon is an enterprise-class performance monitoring and capacity planning tool designed for IT infrastructure management. Version 2.0 introduces enhanced features including improved data visualization, extended platform support, and optimized performance metrics collection. The tool specializes in monitoring VMware, Nutanix, Cisco UCS, storage arrays, and various other enterprise platforms.
System Requirements
Before beginning the installation, ensure your system meets these minimum requirements:
Hardware Requirements
- CPU: Dual-core processor (quad-core recommended for larger environments)
- RAM: Minimum 4GB (8GB or more recommended for production)
- Disk Space: 50GB minimum (storage requirements scale with monitored infrastructure size)
- Network: Stable network connectivity to monitored devices
Software Requirements
- Operating System: Red Hat Enterprise Linux 7/8, CentOS 7/8, or compatible distribution
- Perl: Version 5.10 or higher
- Web Browser: Modern browser (Chrome, Firefox, Safari, Edge) for web interface access
- SSH Access: Root or sudo privileges required
Pre-Installation Checklist
Proper preparation ensures a smooth installation process:
- Verify system compatibility: Check that your Linux distribution is supported
- Disable SELinux temporarily: This prevents permission conflicts during installation
- Configure firewall rules: Ensure necessary ports are accessible
- Prepare monitoring credentials: Gather login credentials for devices you’ll monitor
- Backup existing data: If upgrading from a previous version, backup your configuration
Step-by-Step Installation Process
Step 1: Download Xormon 2.0
Access the official Xormon website and download the latest 2.0 installation package. You can download directly to your server using wget:
bash
wget http://www.xormon.com/xormon-latest.tarVerify the download completed successfully by checking the file size and integrity.
Step 2: Extract the Installation Package
Navigate to your download directory and extract the tarball:
tar xvf xormon-latest.tar
cd xormon
The extraction creates a directory containing all necessary installation scripts and components.
Step 3: Run the Installation Script
Execute the installation script with root privileges:
sudo ./install.sh
The installation script performs several automated tasks including dependency checking, directory creation, file deployment, and initial configuration. The process typically takes 5-10 minutes depending on your system performance.
During installation, you’ll be prompted to confirm various settings. Accept the defaults for a standard installation or customize paths and parameters based on your requirements.
Step 4: Configure Web Server Access
Xormon 2.0 includes an integrated web server. After installation completes, verify the web server is running:
sudo systemctl status xormon
If the service isn’t running, start it manually:
sudo systemctl start xormon
sudo systemctl enable xormon
The web interface is accessible on port 8162 by default.
Step 5: Access the Web Interface
Open your web browser and navigate to:
http://your-server-ip:8162
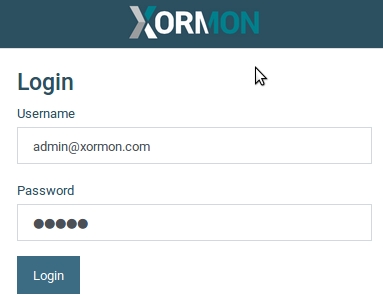
You should see the Xormon login page. Default credentials are typically provided during installation or documented in the README file located in the installation directory.
Step 6: Initial Configuration
Upon first login, complete the initial setup wizard:
- License activation: Enter your license key or proceed with the trial version
- Admin password: Set a secure administrator password
- Time zone configuration: Select your appropriate time zone for accurate data timestamps
- Email notifications: Configure SMTP settings for alert notifications (optional but recommended)
Step 7: Add Monitoring Targets
Begin adding infrastructure components to monitor:
- Navigate to the “Configuration” section
- Select “Add Device” or “Add Platform”
- Choose your platform type (VMware vCenter, Nutanix Prism, storage array, etc.)
- Enter connection details including hostname/IP, port, and authentication credentials
- Test the connection and save
Xormon will immediately begin collecting performance data from configured devices.
Click here to read more about Xormon new features
Post-Installation Configuration
Optimize Data Collection
Adjust collection intervals based on your monitoring requirements. Shorter intervals provide more granular data but increase system resource usage:
- Standard environments: 5-minute intervals
- Critical systems: 1-2 minute intervals
- Large-scale deployments: 10-15 minute intervals
Configure Alerting
Set up proactive alerts for critical thresholds:
- Define performance thresholds for CPU, memory, storage, and network metrics
- Configure alert recipients and notification methods
- Test alert functionality to ensure proper delivery
Secure Your Installation
Implement these security best practices:
- Change all default passwords immediately
- Configure SSL/TLS for encrypted web access
- Restrict access using firewall rules
- Enable audit logging for compliance requirements
- Regularly update to the latest patches and versions
Troubleshooting Common Installation Issues
Port Conflicts
If the default port 8162 is already in use, modify the configuration file located at /opt/xormon/etc/web_config.cfg and restart the service.
Permission Errors
Installation failures due to permission issues typically indicate SELinux is enforcing. Temporarily disable SELinux:
sudo setenforce 0
After installation, re-enable SELinux and configure appropriate contexts.
Database Connection Failures
Xormon uses RRDtool for data storage. If you encounter database errors, verify that RRDtool is properly installed:
rrdtool --version
Reinstall if necessary using your distribution’s package manager.
Web Interface Not Loading
If the web interface is inaccessible, check firewall rules:
sudo firewall-cmd --permanent --add-port=8162/tcp
sudo firewall-cmd --reload
Also verify the xormon service is actively running.
Performance Optimization Tips
Based on real-world deployment experience, these optimizations improve Xormon performance:
System-Level Optimization
- Allocate sufficient memory: Xormon performance scales with available RAM
- Use SSD storage: Fast disk I/O significantly improves data processing
- Optimize network connectivity: Ensure low-latency connections to monitored devices
Application-Level Optimization
- Limit retention periods: Configure appropriate data retention based on storage capacity
- Disable unnecessary metrics: Only collect metrics you actively use
- Schedule reports during off-peak hours: Resource-intensive reports should run during low-activity periods
Upgrading from Previous Versions
If you’re upgrading from Xormon 1.x:
- Backup your existing installation directory completely
- Export current configurations and custom reports
- Stop the existing Xormon service
- Run the 2.0 installation script (it will detect and preserve existing data)
- Verify all monitoring targets reconnect successfully
- Reconfigure any custom settings that didn’t migrate automatically
Integration with Other Tools
Xormon 2.0 supports integration with various enterprise tools:
- Syslog servers: Forward alerts and events for centralized logging
- ITSM platforms: Integrate with ticketing systems for automated incident creation
- Custom scripts: Use the API for custom integrations and automation
Maintenance Best Practices
Regular maintenance ensures optimal performance:
- Weekly: Review alert configurations and adjust thresholds
- Monthly: Check disk space utilization and archive old data
- Quarterly: Update to latest maintenance releases
- Annually: Review monitoring coverage and add new infrastructure components
Conclusion
Installing Xormon 2.0 is straightforward when following this systematic approach. The platform provides powerful monitoring capabilities that help IT teams proactively manage infrastructure performance. With proper configuration and regular maintenance, Xormon becomes an invaluable tool for capacity planning, performance analysis, and infrastructure optimization.
Remember that successful monitoring goes beyond installation. Continuously refine your alert thresholds, regularly review performance trends, and leverage Xormon’s reporting capabilities to make data-driven infrastructure decisions.
For additional support, consult the official Xormon documentation, community forums, or contact their technical support team for enterprise-level assistance.


