Physical Address
304 North Cardinal St.
Dorchester Center, MA 02124
Physical Address
304 North Cardinal St.
Dorchester Center, MA 02124

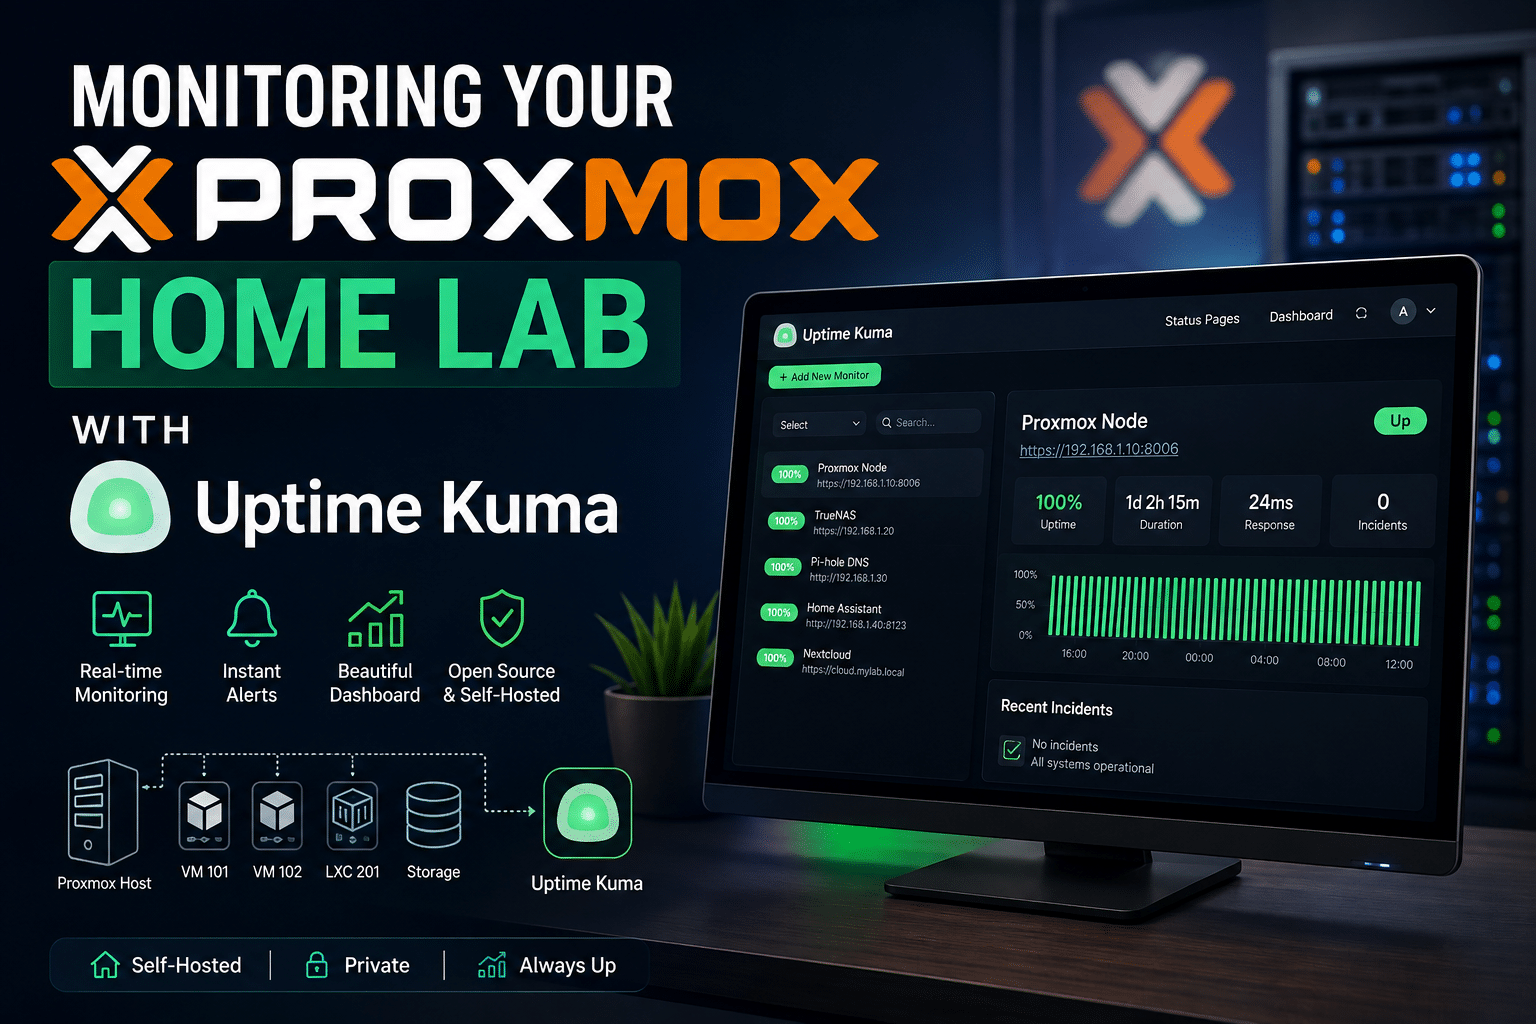
A Proxmox home lab tends to grow quietly. You start with one VM, then a couple of LXC containers for Pi-hole and Home Assistant, then a Docker host for a handful of self-hosted apps, and within a few months you’re running fifteen services across five or six guests without ever having decided to build “infrastructure.” Nobody hands you an outage report in a home lab. You find out something broke when Pi-hole stops resolving DNS for the whole house, or when you go to check a security camera feed and Frigate hasn’t been responding for two days.
That gap between “something broke” and “you noticed” is the entire problem monitoring solves. Uptime Kuma closes it by continuously checking whether your services are actually reachable and alerting you the moment one isn’t, instead of leaving you to discover it by accident.

This guide is specifically about pointing Uptime Kuma at a Proxmox environment the host itself, the VMs and LXC containers running on it, and the services inside those guests. If you’re new to Proxmox, the explanations below assume no prior monitoring experience but do assume you already have a working Proxmox VE installation. If you’ve been running Proxmox for years and are just adding monitoring for the first time, skip ahead to whichever section fills your actual gap the structure is built for that.
One thing worth being direct about before you start: Uptime Kuma tells you whether something is reachable. It does not tell you why a healthy-looking VM is about to run out of disk space, or why a container’s memory usage has been climbing for six hours. That’s a different, complementary kind of monitoring internal resource visibility rather than external availability and it’s worth knowing the boundary before you build your setup around Uptime Kuma alone. If host-level resource monitoring turns out to be a gap you also need to close, that’s a separate, deliberately lightweight tool to add on top, not something to expect from Uptime Kuma itself.
Before you start, confirm you have:
https://your-proxmox-ip:8006)You do not need Docker experience to follow this guide, though one of the two installation paths below uses it. Both are covered in full.
There are two practical paths for a Proxmox home lab. Pick based on how much you want automated for you versus how much you want to understand and control directly.
The Proxmox VE Community Scripts project maintains a well-tested collection of installer scripts that spin up a preconfigured LXC container for dozens of self-hosted applications, Uptime Kuma included. This is the fastest way to get running and is a reasonable default for most home labs.
From the Proxmox shell (the >_ console icon on your Proxmox node in the web UI, or SSH directly to the host):
bash -c "$(wget -qLO - https://raw.githubusercontent.com/community-scripts/ProxmoxVE/main/ct/uptimekuma.sh)"
The script walks through an interactive setup: container ID, hostname, storage location, disk size, CPU/RAM allocation, and network configuration. Defaults are sensible for a home lab (2GB RAM, 4GB disk, DHCP networking) — adjust only if you have a specific reason to. <blockquote>
Note before running any community script: review the script source before piping it into bash if you’re not already familiar with the Community Scripts project. This is good practice for any curl/wget-to-bash pattern, not a Kuma-specific concern. </blockquote>
Once the script finishes, it prints the container’s assigned IP address and the port Uptime Kuma is listening on (3001 by default). Open http://<container-ip>:3001 in a browser to reach the initial setup wizard.
If you’d rather build the container yourself and understand exactly what’s running, create a new LXC container from the Proxmox web UI:
Once the container is running, shell into it (pct enter <container-id> from the Proxmox host, or SSH directly) and install Docker:
curl -fsSL https://get.docker.com | sh
Then deploy Uptime Kuma with Docker Compose:
mkdir -p /opt/uptime-kuma && cd /opt/uptime-kuma
nano docker-compose.yml
services:
  uptime-kuma:
    image: louislam/uptime-kuma:2
    container_name: uptime-kuma
    volumes:
      - ./data:/app/data
    ports:
      - 3001:3001
    restart: always
docker compose up -d
This mirrors a standard Docker-based Uptime Kuma install if you want the fuller walkthrough on reverse proxy setup, backup strategy, or troubleshooting the Docker deployment itself, that’s covered in depth in our main Uptime Kuma Docker installation guide; this article focuses specifically on what to monitor once it’s running.
Either path gets you to the same place: a working Uptime Kuma instance reachable on port 3001, ready for the admin account setup wizard on first visit.
This is the part generic Uptime Kuma tutorials skip, because it’s specific to what a Proxmox environment actually looks like: a hypervisor host, a set of VMs and LXC containers, and services running inside those guests. Each layer needs a different monitor type.
The Proxmox web UI runs on port 8006 over HTTPS with a self-signed certificate by default. Add a monitor:
https://your-proxmox-ip:8006If you’re running a Proxmox cluster, add one monitor per node each node’s web UI is independently reachable even though they share cluster state, and you want to know specifically which node went down, not just that “Proxmox” has a problem.
PBS listens on port 8007 by default, same self-signed-certificate situation as the main Proxmox UI:
https://your-pbs-ip:8007Here’s the honest limitation to understand up front: Uptime Kuma has no native way to query the Proxmox API for VM or LXC power state. It doesn’t know a guest is “stopped” in the Proxmox sense it only knows whether something it can reach over the network responds. In practice this distinction rarely matters, because a stopped VM and an unreachable VM produce the same result (no response), but it’s worth knowing that Uptime Kuma is checking network reachability, not querying Proxmox’s own state directly. Tools built specifically around the Proxmox API (Pulse, ProxMenux, and similar dashboards) fill that specific gap if you need true power-state visibility a different, narrower job than what Uptime Kuma is for.
With that understood, the practical approach for each guest is a Ping monitor at minimum, layered with more specific checks for what’s actually running inside:
Basic reachability (every guest):
Application-specific checks (layer these on top of ping for anything running a service):
| Guest / Service | Monitor Type | What to check |
|---|---|---|
| Pi-hole | HTTP(s) | http://pihole-ip/admin — confirms the web UI, not just the host, is responding |
| Home Assistant | HTTP(s) | http://ha-ip:8123 |
| A Docker host running multiple containers | Docker Container | Uses Uptime Kuma’s native Docker monitor type, requires mounting the Docker socket — see the Docker-container-monitoring section of our main Uptime Kuma installation guide for the full setup |
| Nextcloud, Immich, or similar self-hosted apps | HTTP(s) + Keyword | Add a keyword check for text you know appears on a successful page load, catching cases where the server responds but the app itself has errored |
| SSH access to any guest | TCP Port | Port 22 — useful for guests you manage purely via SSH and don’t run a web service on |
| A reverse-proxied service with a public domain | HTTP(s) | Check the actual external domain, not just the internal IP — this validates your reverse proxy and DNS are working, not just the backend service |
This layered approach ping plus an application-specific check matters because a ping success only tells you the guest’s network stack is up. It says nothing about whether the actual application inside is functioning. A VM that responds to ping while its web server has crashed will show as “up” on a ping-only monitor and silently fail every actual use case you care about.
Once you’re past ten or fifteen monitors, use Uptime Kuma’s tagging feature (available when adding or editing a monitor) to group by function “Proxmox Infrastructure,” “Network Services,” “Media Stack,” whatever matches how you think about your lab. This makes the dashboard scannable at a glance instead of becoming an undifferentiated list, and it lets you build a status page later that only surfaces the tags you actually want visible.
A monitor without a notification attached is just a colored dot nobody sees until they happen to open the dashboard. Configure at least one notification channel before you walk away from this setup.
For a home lab, a self-hosted push option (Gotify or ntfy) paired with a mobile-friendly option (Telegram) is a solid default one gives you a notification history independent of any third-party service, the other gets a push alert to your phone with minimal setup. Full step-by-step instructions for connecting Discord, Telegram, and Gotify specifically are covered in our dedicated notifications setup guide; the Proxmox-specific consideration here is what to attach notifications to and how aggressively.
Practical tuning for a home lab:
Don’t run your monitor on the same host it exists to warn you about, without a plan for that failure mode. If Uptime Kuma runs as an LXC container on your only Proxmox node, and that node goes down entirely, your monitoring tool goes down with the infrastructure it was watching you get silence instead of an alert. This is an acceptable, common trade-off for a single-node home lab (there’s no realistic way around it without a second physical machine), but it’s worth knowing consciously rather than discovering it during an actual outage. If you want a check on the monitor itself, a free-tier external SaaS uptime checker pinging your Kuma dashboard’s public URL (if you expose one) closes that specific gap without any real cost or complexity.
Match check interval to what you’re actually protecting against. A 60-second interval is more than adequate for nearly everything in a home lab. Checking every 10–15 seconds across dozens of monitors adds load and noise without meaningfully improving your reaction time to anything that matters at home-lab scale.
Treat the reverse proxy in front of any externally-exposed services as its own monitoring surface, separate from the backend service. A misconfigured proxy rule or an expired certificate can take a service offline while the VM or container behind it looks completely healthy checking the actual external URL, not just the internal IP, is what catches this.
Revisit your monitor list periodically. Home labs evolve services get decommissioned, IPs change when you reorganize your network, containers get replaced. A stale monitor pointed at something that no longer exists either sits permanently red (training you to ignore red monitors generally) or gets silently deleted and forgotten. Neither is good; a quick quarterly pass to prune and update is worth the ten minutes it takes.
Consider what Uptime Kuma isn’t showing you. If you’ve built out enough infrastructure that resource exhaustion a disk quietly filling up, memory creeping toward a limit has started causing outages you only catch after the fact through Uptime Kuma’s downtime alerts, that’s the signal you’ve outgrown external-availability monitoring alone. Pairing Uptime Kuma with a lightweight internal resource monitor gives you the leading indicator before the outage, rather than just the confirmation after. We cover this specific pairing and where the line falls between the two kinds of monitoring in our Uptime Kuma vs. Beszel comparison.
| Problem | Likely Cause | Fix |
|---|---|---|
| Proxmox host monitor shows Down immediately after creation | Self-signed certificate rejected by default | Enable Ignore TLS/SSL error under the monitor’s Advanced settings |
| LXC container never gets an IP address after community script install | DHCP not reachable on the selected bridge/VLAN, or the container’s network config defaulted incorrectly | Check the container’s network settings in the Proxmox UI (pct config <id>), confirm it’s attached to the correct bridge, and that a DHCP server is actually reachable there |
| Docker fails to start inside a manually created LXC container | Nesting feature not enabled | Stop the container, go to Options → Features in the Proxmox UI, enable Nesting, restart the container |
| Monitor for a VM on a different VLAN never comes up, even though the VM is running | Firewall or routing rules blocking traffic between the Uptime Kuma container’s network and the target VLAN | Check Proxmox’s firewall rules (both at the datacenter and node/guest level) and any router-level inter-VLAN routing rules |
| Dashboard accessible locally but not through your reverse proxy / external domain | Reverse proxy not forwarding WebSocket upgrade headers — Uptime Kuma’s dashboard depends on a live WebSocket connection | Confirm your proxy config explicitly forwards Upgrade and Connection headers; this is covered in detail in our reverse proxy setup guide |
| Ping monitors constantly flapping between up and down | ICMP being rate-limited or deprioritized somewhere in the path, common on some consumer router/switch firmware under load | Try a TCP Port check on a known-open port instead of ICMP ping for that specific guest, since TCP checks aren’t subject to the same rate limiting some networking gear applies to ICMP |
| Community script install completes but port 3001 isn’t reachable | A host-level firewall (ufw, or Proxmox’s own firewall if enabled on that container) blocking the port | Check ufw status inside the container, or the Proxmox firewall rules applied to that specific CT/VM ID |
Uptime Kuma doesn’t need to sit apart from the rest of your home lab tooling. A few integration points worth setting up once the base monitoring is in place:
None of these are required to get value out of the setup covered above a working Uptime Kuma instance watching your Proxmox host, your VMs and LXC containers, and the services running inside them is a complete, useful monitoring layer on its own. The integration points are what turn it from “a tool you check” into part of how the rest of your home lab actually operates.

We have detected that you are using extensions to block ads. Please support us by disabling these ads blocker.