Physical Address
304 North Cardinal St.
Dorchester Center, MA 02124
Physical Address
304 North Cardinal St.
Dorchester Center, MA 02124

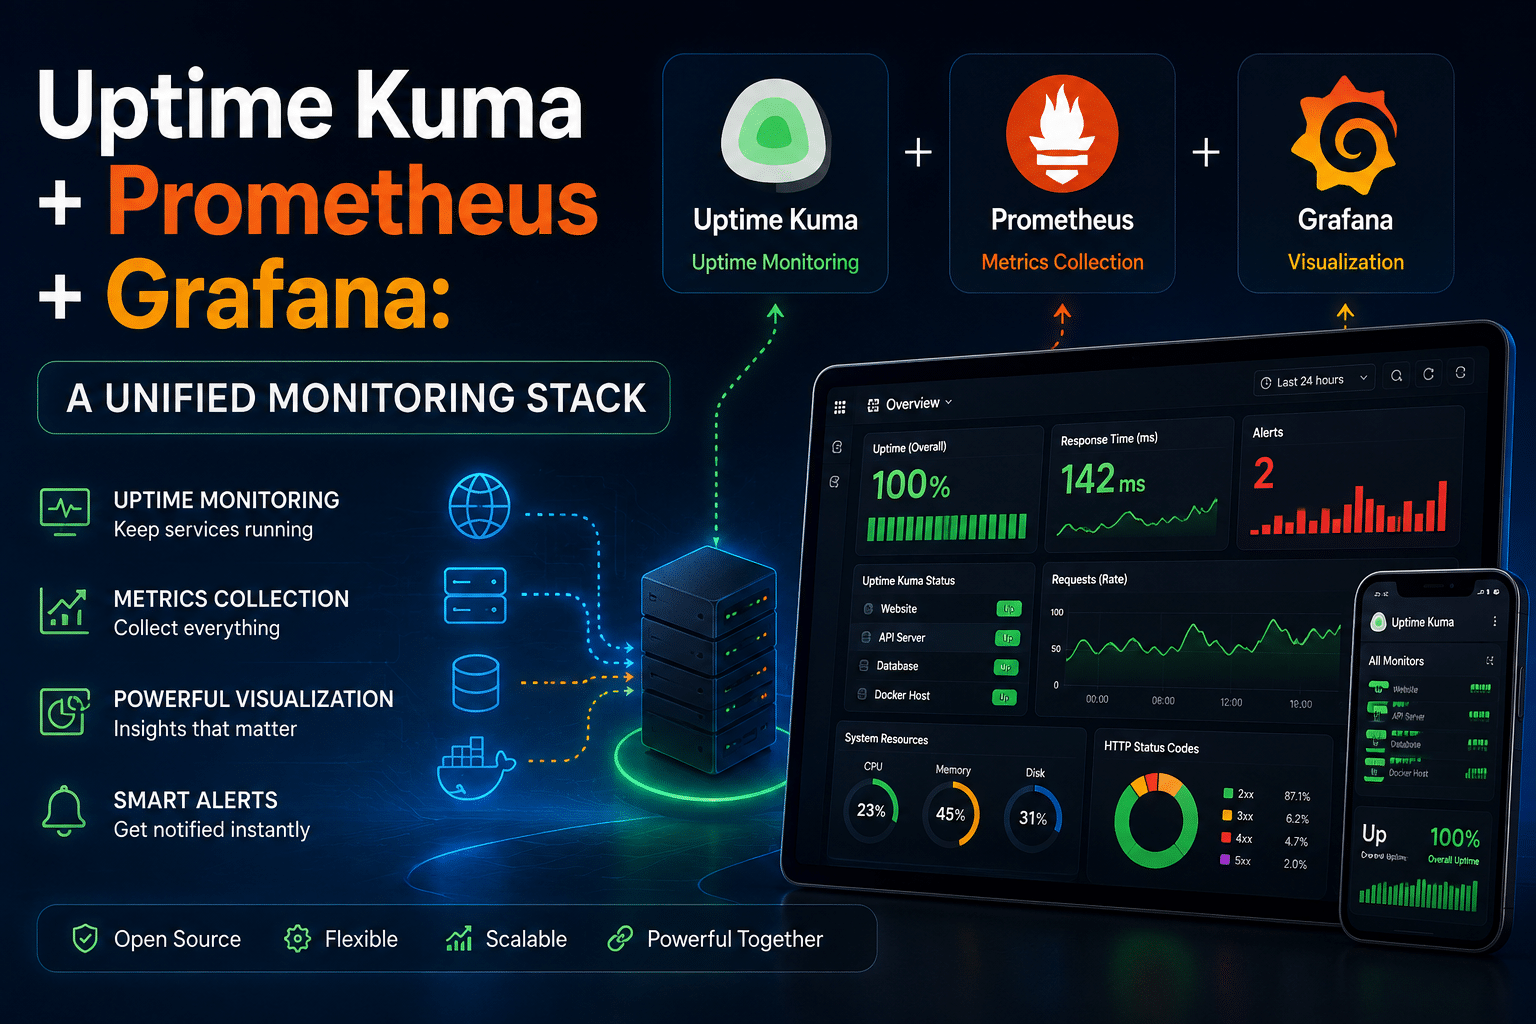
Prometheus and Grafana handle metrics well. What they don’t do natively is active black-box probing actually reaching out to an endpoint on a schedule and confirming it responds. That’s normally solved with blackbox_exporter, which works but requires writing and maintaining probe configs in YAML with no dashboard of its own. Uptime Kuma already does this job, with a UI for adding monitors in seconds and 90+ notification integrations built in. Point Prometheus at Uptime Kuma’s /metrics endpoint instead of standing up blackbox_exporter, and you get active uptime probing with a proper management UI, feeding into the same Prometheus/Grafana stack you’re likely already running for infrastructure metrics.
The resulting architecture: Uptime Kuma performs the checks and exposes results as Prometheus metrics → Prometheus scrapes and stores them as time series → Grafana queries Prometheus and renders dashboards, sitting alongside whatever else you’re already visualizing (node_exporter host metrics, application metrics, OpenTelemetry traces). Nobody’s data lives in three disconnected places Grafana becomes the single pane of glass.

Versus managed alternatives (Datadog Synthetics, Grafana Cloud’s own synthetic monitoring, Better Uptime): you give up a hosted SLA and multi-region probing, and you take on the operational burden of running all three services yourself. What you get back is zero per-check billing, full data retention control, and a stack that scales to as many monitors as your hardware can handle rather than your pricing tier. For a team already self-hosting Prometheus and Grafana for infrastructure metrics, adding Uptime Kuma as a source is close to free you’re extending an investment you’ve already made rather than starting a new one.
This spins up all three services on a shared network, with persistent volumes for each. Deploy this as-is for a working stack, then move to configuration below.
services:
  prometheus:
    image: prom/prometheus:latest
    container_name: prometheus
    volumes:
      - ./prometheus/prometheus.yml:/etc/prometheus/prometheus.yml
      - prometheus-data:/prometheus
    command:
      - "--config.file=/etc/prometheus/prometheus.yml"
      - "--storage.tsdb.retention.time=30d"
    ports:
      - "9090:9090"
    restart: unless-stopped
    networks:
      - monitoring

  grafana:
    image: grafana/grafana:latest
    container_name: grafana
    environment:
      - GF_SECURITY_ADMIN_PASSWORD=changeme
      - GF_USERS_ALLOW_SIGN_UP=false
    volumes:
      - grafana-data:/var/lib/grafana
    ports:
      - "3000:3000"
    restart: unless-stopped
    networks:
      - monitoring
    depends_on:
      - prometheus

  uptime-kuma:
    image: louislam/uptime-kuma:2
    container_name: uptime-kuma
    volumes:
      - uptime-kuma-data:/app/data
    ports:
      - "3001:3001"
    restart: unless-stopped
    networks:
      - monitoring

networks:
  monitoring:
    driver: bridge

volumes:
  prometheus-data:
  grafana-data:
  uptime-kuma-data:
Bring it up:
mkdir -p prometheus
# create prometheus/prometheus.yml (see below) before starting
docker compose up -d
<blockquote>
Container networking note: because all three services share the monitoring bridge network, they can reach each other by container name (uptime-kuma, prometheus, grafana) rather than localhost or external IPs. This is the single most common source of “connection refused” errors when adapting Docker Compose examples every reference below to uptime-kuma:3001 depends on this shared network. </blockquote>
Create prometheus/prometheus.yml before starting the stack:
global:
  scrape_interval: 30s
  evaluation_interval: 30s

scrape_configs:
  - job_name: "prometheus"
    static_configs:
      - targets: ["localhost:9090"]

  - job_name: "uptime-kuma"
    metrics_path: /metrics
    scheme: http
    static_configs:
      - targets: ["uptime-kuma:3001"]
    basic_auth:
      username: "api"
      password: "REPLACE_WITH_API_KEY"
Leave the basic_auth block in place for now you’ll fill in the real API key once Uptime Kuma is running (step 3). Restart Prometheus after any config change:
docker compose restart prometheus
Confirm Prometheus is healthy at http://localhost:9090 — the Status → Targets page is where you’ll verify the Uptime Kuma scrape target once it’s fully wired up.
Open http://localhost:3000 (default login admin / the password set in the Compose file), then:
http://prometheus:9090 (container name, not localhost — see the networking note above)Open http://localhost:3001, complete the admin setup wizard if you haven’t already, then:
<blockquote>
Adding an API key permanently disables basic username/password authentication on the /metrics endpoint — this is by design, not a bug. Once you add your first key, only API-key auth works for that endpoint going forward. The username field in the scrape config’s basic_auth block is ignored entirely; only the password field (your API key) matters. Setting it to any placeholder value like api is a convention, not a requirement. </blockquote>
Now go back to prometheus/prometheus.yml and replace REPLACE_WITH_API_KEY with the actual key, then:
docker compose restart prometheus
Verify the scrape is live by checking Prometheus’s target page (http://localhost:9090/targets) — the uptime-kuma job should show UP. You can also confirm the raw metrics output directly:
curl -u api:YOUR_API_KEY http://localhost:3001/metrics
You should see Prometheus exposition-format output including monitor_status and monitor_response_time gauges, one series per monitor you’ve configured in Uptime Kuma.
Uptime Kuma’s /metrics endpoint exposes several gauges per monitor. The two that matter most:
monitor_status{monitor_name="API Gateway",monitor_type="http",monitor_url="https://api.example.com"} 1
monitor_response_time{monitor_name="API Gateway",monitor_type="http",monitor_url="https://api.example.com"} 142
monitor_status values map to Uptime Kuma’s internal states: 1 = up, 0 = down, 2 = pending, 3 = maintenance. monitor_response_time is in milliseconds.
Useful PromQL queries to build panels from:
# Current status of every monitor, one row per monitor
monitor_status

# Only monitors currently down
monitor_status == 0

# Response time for a specific monitor
monitor_response_time{monitor_name="API Gateway"}

# Average response time across all monitors, grouped by name
avg(monitor_response_time) by (monitor_name)

# Uptime percentage over the last 24h (requires the recording — see below)
avg_over_time(monitor_status[24h]) * 100
That last query is doing real work: since monitor_status is 1 when up and 0 when down, averaging it over a time window and multiplying by 100 gives you a genuine uptime percentage for any arbitrary window Prometheus has retention for something Uptime Kuma’s own UI shows per-monitor but doesn’t let you query flexibly across arbitrary time ranges or aggregate across groups the way PromQL does.
Rather than hand-building panels, import one of the community dashboards published for exactly this integration:
After import, use the dashboard’s Datasource, Job, and Instance dropdowns (top left) to point it at your actual Prometheus job name if you followed the prometheus.yml above, the job name is uptime-kuma. A dashboard showing “No Data” immediately after import is almost always this dropdown not yet pointed at the right job, not a broken scrape.
The actual value of this integration shows up once you put an Uptime Kuma panel next to a host-metrics panel (e.g. from node_exporter) on the same dashboard row a service’s monitor_status dropping to 0 at the same timestamp a host’s memory usage graph spikes toward 100% is a correlation you’d otherwise have to manually cross-reference between two separate tools. A minimal panel JSON for a status timeline, addable directly into an existing dashboard’s JSON model:
{
  "type": "state-timeline",
  "title": "Service Status",
  "datasource": { "type": "prometheus", "uid": "YOUR_PROMETHEUS_UID" },
  "targets": [
    {
      "expr": "monitor_status",
      "legendFormat": "{{monitor_name}}",
      "refId": "A"
    }
  ],
  "fieldConfig": {
    "defaults": {
      "mappings": [
        { "type": "value", "options": { "0": { "text": "DOWN", "color": "red" } } },
        { "type": "value", "options": { "1": { "text": "UP", "color": "green" } } }
      ]
    }
  }
}
Replace YOUR_PROMETHEUS_UID with your data source’s actual UID (visible in the data source’s settings URL in Grafana), drop this into an existing dashboard’s panel list via the JSON model editor, and you have a color-coded status timeline sitting next to whatever infrastructure panels you already have.
Scrape interval: 30s is a reasonable default for uptime status matching or slightly loosening Uptime Kuma’s own heartbeat interval (commonly 60s) avoids scraping faster than the underlying data actually changes. There’s no benefit to scraping more frequently than Uptime Kuma checks.
Retention: the --storage.tsdb.retention.time=30d flag in the Compose file above is a starting point. Uptime Kuma’s own dashboard already retains heartbeat history natively Prometheus’s value here is long-term trend analysis and cross-correlation with other metrics, not being your only source of uptime history. Size retention to what your actual analysis needs are, not by default.
Cardinality: each monitor produces its own label set (monitor_name, monitor_type, monitor_url). This scales fine into the hundreds of monitors on modest hardware — Prometheus’s cardinality concerns show up in the tens-of-thousands-of-series range, well beyond what a typical self-hosted Uptime Kuma instance produces. Not a practical concern at home lab or small-team scale.
Alerting ownership — pick one source of truth. Both Prometheus (via Alertmanager) and Uptime Kuma (via its own 90+ notification providers) can fire alerts on the same down event. Running both means duplicate notifications for every incident. The cleaner split: let Uptime Kuma own notification delivery (it already has the integrations built and tested — see our Discord/Telegram/Gotify setup guide), and let Prometheus/Grafana own trend-based and correlation alerting — the multi-signal scenario Uptime Kuma can’t reason about on its own, e.g. “alert if monitor_status == 0 AND host memory usage was above 90% in the preceding 10 minutes.” Don’t wire the same simple down/up event through both paths.
Reverse proxy all three for external access, not just Uptime Kuma if you’re exposing this stack beyond your local network, Grafana and Prometheus need the same TLS/WebSocket-aware reverse proxy treatment as any other self-hosted service. This is covered in depth in our Uptime Kuma reverse proxy guide, and the same header requirements (particularly WebSocket upgrade headers for Grafana’s live features) apply.
| Symptom | Cause | Fix |
|---|---|---|
Prometheus target shows DOWN for the uptime-kuma job | Wrong target address, or API key not yet updated in prometheus.yml | Confirm the target uses the container name (uptime-kuma:3001), not localhost; confirm the password field has the real API key, not the placeholder |
401 Unauthorized from /metrics even with a correct API key | A known issue in some Uptime Kuma versions (tracked upstream) where basic auth against /metrics fails even with valid credentials, particularly after certain upgrades | Confirm you’re on a current Uptime Kuma release; test with curl -u api:KEY directly against the container to isolate whether the problem is Prometheus’s config or Uptime Kuma itself; if it persists on a current version, check the project’s GitHub issues for the specific version affected |
| Grafana dashboard shows “No Data” immediately after import | Dashboard’s Datasource/Job/Instance template variables not pointed at your actual Prometheus data source and job name | Use the dropdowns at the top of the imported dashboard to select the correct data source and the uptime-kuma job explicitly |
Metrics appear in curl output but not in Prometheus | Prometheus config not reloaded after editing, or a YAML indentation error | docker compose restart prometheus, then check docker compose logs prometheus for config parse errors |
| Grafana can’t reach Prometheus data source (“bad gateway” or connection refused) | Using localhost:9090 instead of the container name inside a shared Docker network | Set the data source URL to http://prometheus:9090 |
| Duplicate alerts for the same outage | Both Alertmanager and Uptime Kuma’s own notifications configured for the same event | Pick one alerting path per event type — see the Optimization section above |
| New monitors added in Uptime Kuma don’t show up in Grafana | Not a bug — Prometheus only picks up new series on its normal scrape interval | Wait for the next scrape cycle (default 30s in the config above), or check /metrics directly via curl to confirm the new monitor is actually present in Uptime Kuma’s output first |
Once this is running, the marginal cost of adding a new check is trivial — a new monitor in Uptime Kuma appears in Prometheus on the next scrape and in Grafana on the next dashboard refresh, with zero additional configuration in either downstream tool. That’s the actual payoff of wiring these together instead of running Uptime Kuma as an island: every monitor you add from here forward is already integrated into the rest of your observability stack by default.

We have detected that you are using extensions to block ads. Please support us by disabling these ads blocker.