Monitoring and Alerts in VMware vCenter: A Comprehensive Guide

Table of Contents
Introduction
Monitoring and alerts in VMware vCenter are essential for maintaining a healthy virtual infrastructure. Proper monitoring ensures optimal performance, early problem detection, and efficient resource utilization. This guide is designed to provide users with a clear understanding of how to monitor vCenter effectively using its built-in tools and configure alerts for proactive management.
Using vCenter Performance Monitoring Tools
Overview of vCenter Monitoring
Monitoring in VMware vCenter is the cornerstone of maintaining a healthy, efficient, and optimized virtual infrastructure. It provides administrators with real-time insights, historical data, and actionable intelligence about the performance, health, and resource utilization of all components in the virtual environment, including ESXi hosts, virtual machines (VMs), networks, and storage.
This section explores the purpose, benefits, and components of vCenter monitoring, laying the foundation for effective system management.
Purpose of vCenter Monitoring
The primary goal of vCenter monitoring is to ensure the smooth operation of virtualized environments by identifying and resolving issues before they impact users or workloads.
Key Objectives
Compliance and Audit: Maintain compliance by ensuring all components adhere to organizational and regulatory policies.
Performance Optimization: Monitor CPU, memory, storage, and network usage to maintain balanced resource allocation.
Proactive Issue Detection: Identify anomalies or resource bottlenecks early using real-time alerts and historical trends.
Capacity Planning: Use historical data to predict future resource needs and optimize hardware investments.
Key Components of vCenter Monitoring
Performance Metrics
CPU: Tracks how host and VM processors are utilized.
Memory: Measures allocated, consumed, and available memory resources.
Storage: Analyzes datastore capacity and IOPS (Input/Output Operations Per Second).
Network: Monitors traffic flow, bandwidth usage, and packet loss.
Alarms and Notifications
Configurable triggers for thresholds, such as high CPU usage or low datastore space.
Notifications via email or SNMP for prompt administrator response.
Real-Time and Historical Data
Real-time metrics for immediate troubleshooting.
Historical performance charts for trend analysis and reporting.
Logs and Events
Event logs for auditing and detailed troubleshooting. Integration with tools like vRealize Log Insight for deeper log analysis.
Dashboards and Reports
Customizable dashboards for visual representation of system health. Automated or on-demand reports for resource usage, performance, and anomalies.
Levels of Monitoring in vCenter
VMware vCenter provides a multi-layered approach to monitoring, offering insights into the health and performance of virtual infrastructure at various levels. This hierarchical system enables administrators to focus on specific components or view the overall environment, making it easier to identify and address issues efficiently. Each level of monitoring offers unique metrics and tools to cater to different administrative needs.
Cluster-Level Monitoring
- Aggregates resource usage across multiple hosts.
- Ensures high availability and load balancing.
Use Case: Detecting overcommitted clusters to balance workloads more effectively.
Host-Level Monitoring
Host-level monitoring in vCenter focuses on the health, performance, and resource utilization of ESXi hosts within your virtualized environment. Monitoring hosts ensures that the underlying hardware and resources supporting virtual machines (VMs) are optimized and operating efficiently.
Use Case: Monitoring a host’s CPU temperature to avoid hardware failure.
VM-Level Monitoring
Provides detailed metrics for individual virtual machines. Includes disk latency, network throughput, and application performance.
Use Case: Identifying a VM causing excessive disk I/O that impacts other workloads.
Datastore and Network Monitoring
Ensures storage and network resources are performing optimally. Tracks storage capacity, network bandwidth, and latency.
Use Case: Identifying a datastore with high latency to optimize storage placement.
How to Use Performance Charts
Accessing the Performance Tab
Navigate to the vCenter Web Client. Select the object you want to monitor (e.g., a host or VM). Click the Monitor tab and choose Performance.
Interpreting Metrics
- CPU Usage: Check the percentage of host CPU resources being used by VMs. High usage might indicate over-provisioning.
- Memory Utilization: Monitor allocated versus consumed memory. Ballooning or swapping could signal memory pressure.
- Storage IOPS: High input/output operations per second could affect storage performance.
- Network Throughput: Identify potential bottlenecks in data transfer rates.
Example Scenario
If a VM consistently shows high CPU usage, you may need to either optimize its workload or allocate additional CPU resources.
Configuring Alarms and Notifications
Alarms in vCenter alert administrators when specific thresholds or conditions are met. Configuring alarms helps you respond to issues proactively.
Steps to Configure Alarms
Access Alarm Settings
In vCenter, navigate to Monitor > Alarms > Definitions. Click + Create Alarm.
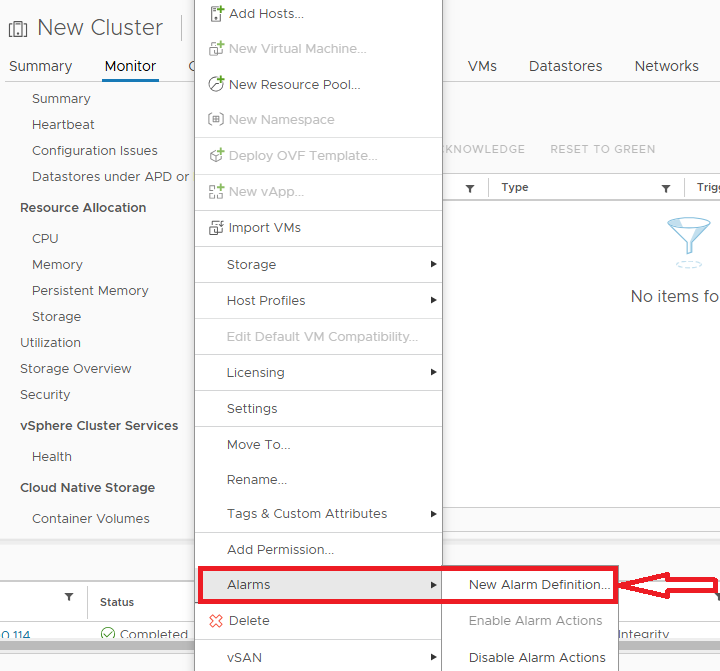
Define Alarm Trigger
An alarm trigger in VMware vCenter is the specific condition or threshold that activates an alarm. It allows administrators to monitor the performance and health of their virtual environment and be notified when defined thresholds are crossed. This helps in identifying and resolving potential issues proactively.
Suppose we want from vCenter to give us alert when a VM CPU usage become above 80% for 1 minute.
Select the object type (e.g., VM, host). Choose the metric (e.g., CPU usage > 80%, datastore space below 10%).
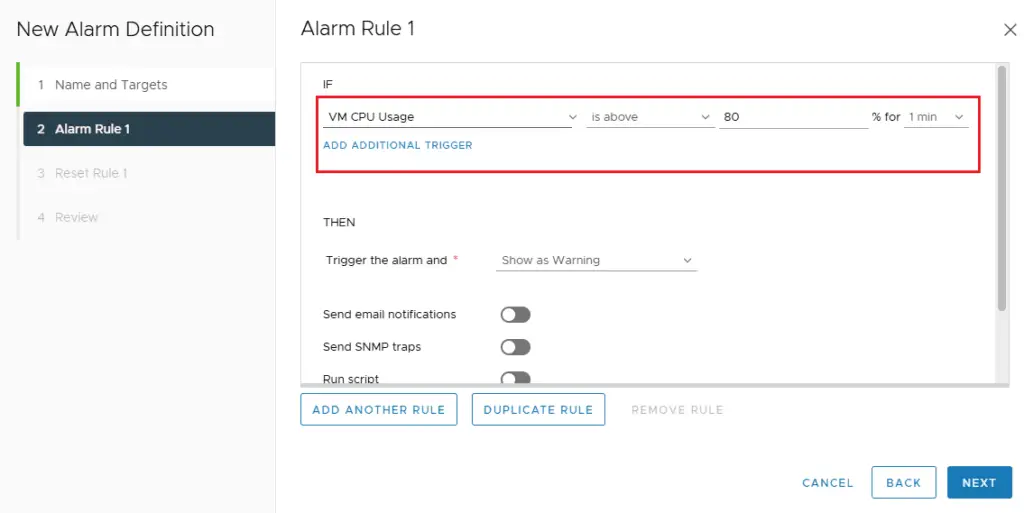
Set Notification Actions
Notification actions in vCenter define how the system responds when an alarm is triggered. These actions ensure that administrators are informed or that predefined tasks are automatically executed to resolve or mitigate issues. By specifying actions, vCenter can either alert relevant personnel or perform corrective measures without manual intervention, improving the environment’s overall stability and performance.
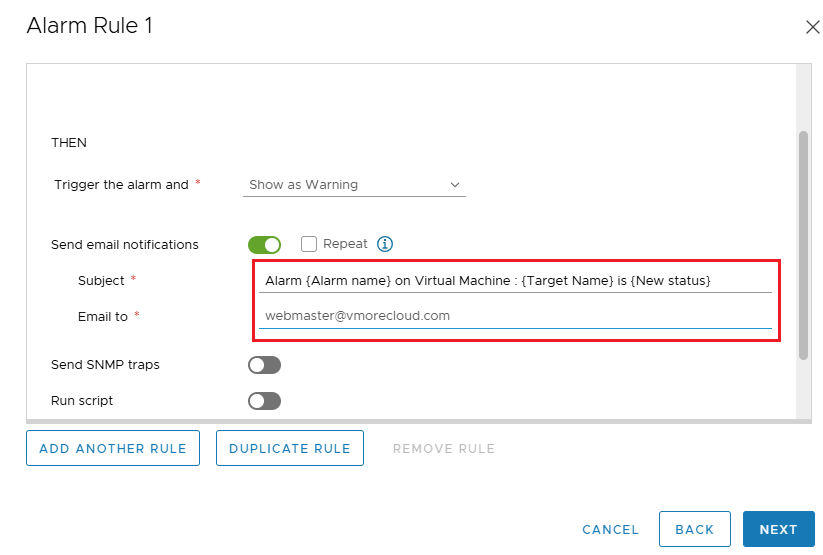
Specify actions like sending an email, running a script, or triggering vCenter tasks (e.g., migrate VMs or increase resources).
Advanced actions in alarm rules provide a deeper level of automation and integration, allowing you to define more sophisticated responses to different issues.
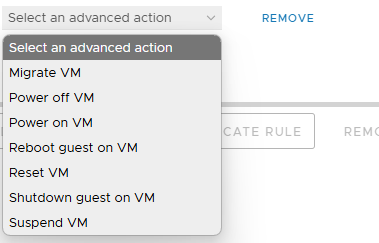
Like if the resources are meeting then we can set rules to migrate or power off the VMs.
Utilizing vCenter Log Insight for Log Analysis
vCenter Log Insight is a powerful tool for log aggregation, analysis, and troubleshooting. It collects logs from vCenter, ESXi hosts, and other components to provide actionable insights.
Key Features
Detect issues as they happen. Pinpoint specific events using keywords or filters. Visualize trends and patterns for better analysis.
How to Use Log Insight
Integrate Log Insight with vCenter:
Deploy the Log Insight appliance. Configure the vCenter and ESXi hosts to forward logs to Log Insight.
Analyze Logs
Use the search function to look for error codes or warnings. Create custom dashboards for frequent issues, like login failures or VM crashes.
Analyzing Performance and Resource Usage Reports
vCenter generates reports to provide detailed insights into resource usage, helping administrators plan and optimize their infrastructure.
Types of Reports
- Host Resource Usage: Analyze CPU, memory, and storage allocation.
- VM Performance: Understand the workloads of individual VMs.
- Cluster Efficiency: Evaluate the balance of resource distribution across clusters.
Steps to Generate Reports
Navigate to the Reports section in vCenter. Select a predefined report template or create a custom report. Export the report in formats like PDF or CSV for further analysis.
Setting Up Automated Actions for Alerts
Automated actions in vCenter reduce manual intervention by executing predefined tasks when an alert is triggered.
How to Set Up Automated Actions
Define Alarm Conditions
- Navigate to the alarm settings and specify the triggering condition.
Configure Actions
- Migrate VM: Move a VM to another host if CPU usage exceeds 90%.
- Power Off VM: Shut down a VM if it consumes excessive resources.
- Send Notifications: Send emails to administrators for critical events.

Common Monitoring Challenges and Solutions
Challenge: Overwhelming Data
Solution: Use dashboards to focus on critical metrics and configure meaningful alerts to reduce noise.
Challenge: False Positives
Solution: Fine-tune alarm thresholds to ensure accuracy and relevance.
Challenge: Resource Contention
Solution: Leverage vSphere DRS to balance workloads and resolve contention automatically.
Challenge: Scaling in Large Environments
Solution: Use tools like vRealize Operations Manager for advanced analytics and scalability.
Conclusion
Monitoring and alerts in VMware vCenter are indispensable for maintaining a robust and efficient virtual infrastructure. By leveraging performance monitoring tools, configuring alarms, analyzing logs with Log Insight, and utilizing automated actions, administrators can proactively manage their environment and ensure peak performance. Start with small configurations and gradually enhance your setup as you become more comfortable with the tools.
With these steps, you’ll not only learn how to use vCenter effectively but also develop the skills to troubleshoot and optimize your virtual infrastructure with confidence.





[…] Monitoring and Alerts in VMware vCenter: A Comprehensive Guide […]
[…] Then select the vCenter for monitoring. […]