Physical Address
304 North Cardinal St.
Dorchester Center, MA 02124
Physical Address
304 North Cardinal St.
Dorchester Center, MA 02124
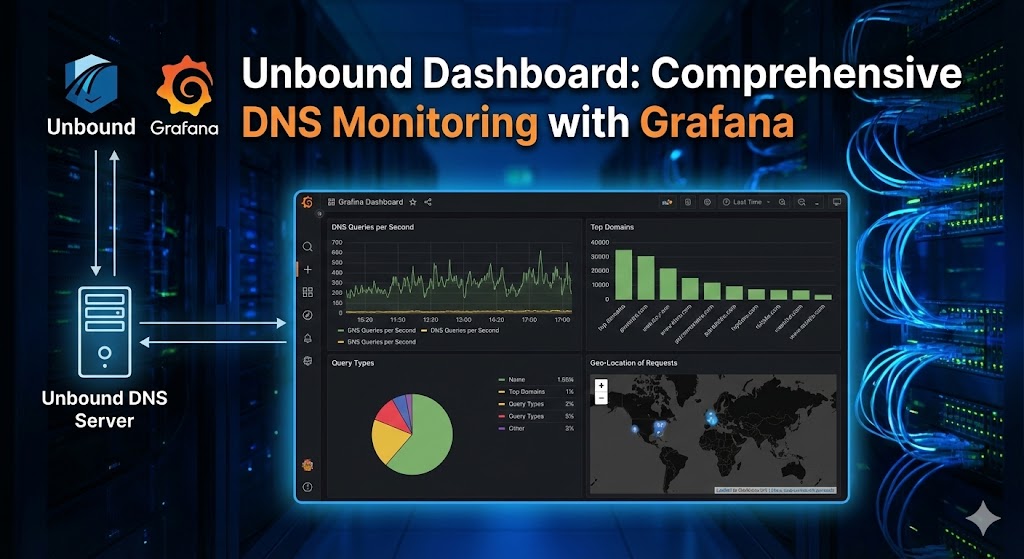
The Unbound Dashboard is a powerful monitoring solution that brings together Grafana, Prometheus, and Loki to provide comprehensive visualization and analysis of your Unbound DNS resolver. This open-source project offers real-time metrics, historical data analysis, and log aggregation in an elegant, easy-to-read interface.
Unbound Dashboard is a complete monitoring stack specifically designed for the Unbound DNS resolver. It leverages industry-standard tools to collect, store, and visualize DNS metrics and logs, giving you deep insights into your DNS infrastructure’s performance and behavior.
The Unbound Dashboard consists of four main components working together seamlessly:
The visualization layer that presents your DNS data through an intuitive web interface. The dashboard includes:
A time-series database that scrapes and stores metrics from the Unbound exporter at regular intervals. It provides:
A custom-built exporter written in Go that:
A log aggregation system that:
The dashboard has been tested on:
The lightweight design makes it suitable for running on modest hardware while still providing enterprise-grade monitoring capabilities.
The setup follows a logical progression through five main steps. Below are detailed instructions for each component.
Before beginning the installation, ensure you have:
Grafana provides the visualization layer for your dashboard.
There are two versions available: OSS (Open Source Software) and Enterprise. The OSS version is recommended as it’s lightweight and sufficient for this use case. Download the appropriate package for your architecture:
# For ARM64 (Raspberry Pi 4, etc.)
wget https://dl.grafana.com/oss/release/grafana_11.1.0_arm64.deb

# For AMD64/x86_64
wget https://dl.grafana.com/oss/release/grafana_11.1.0_amd64.deb
Since Grafana 10.2.3, the musl package is required:
sudo apt install musl
sudo dpkg -i grafana_11.1.0_arm64.deb
The project provides an optimized grafana.ini configuration file that:
To use the optimized configuration:
sudo cp /etc/grafana/grafana.ini /etc/grafana/grafana.ini.backup
grafana.ini from the release to /etc/grafana/Alternatively, you can use the default configuration located at /etc/grafana/grafana.ini.
sudo systemctl daemon-reload
sudo systemctl enable grafana-server
sudo systemctl start grafana-server
Check that Grafana is running:
sudo systemctl status grafana-server
Access the Grafana web interface at http://<your-server-ip>:3000/
Default credentials:
adminadmin (you’ll be prompted to change this on first login)Prometheus collects and stores time-series metrics from the Unbound exporter.
sudo apt update
sudo apt install prometheus
The project provides a trimmed-down prometheus.yml configuration optimized for Unbound monitoring.
sudo cp /etc/prometheus/prometheus.yml /etc/prometheus/prometheus.yml.backup
prometheus.yml from the latest releasesudo cp prometheus.yml /etc/prometheus/
The optimized configuration includes:
Node exporter is installed as part of the Prometheus package but isn’t needed for the Unbound dashboard. If you’re not using it elsewhere:
sudo apt --purge autoremove prometheus-node-exporter
This removes 8 node-exporter related packages, freeing up system resources.
sudo systemctl restart prometheus
Check Prometheus status:
sudo systemctl status prometheus
Access the Prometheus web interface at http://<your-server-ip>:9090/
The Unbound exporter is a custom-built Go application that collects metrics from Unbound and exposes them for Prometheus.
First, enable the necessary features in Unbound:
sudo nano /etc/unbound/unbound.conf
server: section:yaml
extended-statistics: yes
remote-control: section:yaml
control-interface: "/var/run/unbound.sock"
   control-use-cert: no
These enable Unix domain socket communication, which is faster than TCP.
sudo systemctl restart unbound
unbound-exporter binarysudo cp unbound-exporter /usr/local/bin/
sudo chown root:root /usr/local/bin/unbound-exporter
   sudo chmod +x /usr/local/bin/unbound-exporter
To run the exporter automatically at startup:
prometheus-unbound-exporter.service from the releasesudo cp prometheus-unbound-exporter.service /etc/systemd/system/
sudo chown root:root /etc/systemd/system/prometheus-unbound-exporter.service
The service file includes parameters for:
Modify these if you use different paths or names.
sudo systemctl daemon-reload
sudo systemctl enable prometheus-unbound-exporter
sudo systemctl start prometheus-unbound-exporter
Check the service status:
sudo systemctl status prometheus-unbound-exporter
The exporter runs on port 9167 by default. You can test it by accessing:
curl http://localhost:9167/metrics
This should display Prometheus-formatted metrics.
To see available command-line options:
unbound-exporter -h
Loki aggregates and indexes logs, while Promtail scrapes and sends logs to Loki.
# For ARM64
curl -O -L "https://github.com/grafana/loki/releases/download/v3.1.0/loki_3.1.0_arm64.deb"
curl -O -L "https://github.com/grafana/loki/releases/download/v3.1.0/promtail_3.1.0_arm64.deb"
# For AMD64
curl -O -L "https://github.com/grafana/loki/releases/download/v3.1.0/loki_3.1.0_amd64.deb"
curl -O -L "https://github.com/grafana/loki/releases/download/v3.1.0/promtail_3.1.0_amd64.deb"
sudo dpkg -i loki_3.1.0_arm64.deb
sudo dpkg -i promtail_3.1.0_arm64.deb
sudo nano /etc/unbound/unbound.conf
server: section:yaml
log-replies: yes
   log-tag-queryreply: yes
   log-local-actions: yes
   logfile: /var/log/unbound/unbound.log
Important: Ensure verbosity: is set to 0.
sudo mkdir /var/log/unbound
sudo chown unbound:unbound /var/log/unbound
To prevent log files from consuming too much disk space:
unbound logrotate configuration from the release (under the logrotate directory)sudo cp unbound /etc/logrotate.d/
sudo chown root:root /etc/logrotate.d/unbound
config.yml from the release (under the loki directory)sudo cp /etc/loki/config.yml /etc/loki/config.yml.backup
sudo cp config.yml /etc/loki/
sudo chown root:root /etc/loki/config.yml
The optimized Loki configuration is tuned to:
config.yml from the release (under the promtail directory)sudo cp /etc/promtail/config.yml /etc/promtail/config.yml.backup
sudo cp config.yml /etc/promtail/
sudo chown root:root /etc/promtail/config.yml
The Promtail configuration enables scraping of Unbound logs.
sudo systemctl restart unbound
sudo systemctl restart loki
sudo systemctl restart promtail
Check service statuses:
sudo systemctl status loki
sudo systemctl status promtail
Verify that Unbound is logging:
sudo tail -f /var/log/unbound/unbound.log
Now that all components are installed, it’s time to set up the dashboard in Grafana.
http://<your-server-ip>:3000/Prometheushttp://localhost:90905mYou should see a green message confirming the connection.
Lokihttp://localhost:3100100000You should see a confirmation message.
unbound-dashboard.json from the latest releaseunbound-dashboard.json file you downloadedDashboards or create a new folderThe dashboard should now load, displaying your Unbound DNS metrics and logs!
To make the Unbound dashboard your landing page:
Now the Unbound dashboard will load automatically when you access Grafana.
After installation, verify that data is being collected:
Check Unbound Exporter:
sudo systemctl status prometheus-unbound-exporter
curl http://localhost:9167/metrics
Check Prometheus:
udo systemctl status prometheus
# Visit http://<your-server-ip>:9090/targets to see scrape targets
Check Loki and Promtail:
sudo systemctl status loki
sudo systemctl status promtail
sudo tail -f /var/log/unbound/unbound.log
Check Unbound:
sudo systemctl status unbound
sudo unbound-control stats
Once installed, you can customize the dashboard:
By default, Prometheus retains data for 15 days. To adjust this:
sudo nano /etc/default/prometheus
ARGS line:ARGS="--storage.tsdb.retention.time=30d"
sudo systemctl restart prometheus
The Admin API allows you to delete specific metrics or perform maintenance:
sudo nano /etc/default/prometheus
ARGS="--web.enable-admin-api --log.level=warn"
sudo systemctl restart prometheus
# Delete all metrics from a job (e.g., "node")
   curl -X POST -g 'http://localhost:9090/api/v1/admin/tsdb/delete_series?match[]={job="node"}'

   # Clean up tombstones
   curl -X POST -g 'http://localhost:9090/api/v1/admin/tsdb/clean_tombstones'

   # Restart Prometheus
   sudo systemctl restart prometheus
To minimize disk I/O and log file sizes:
For Prometheus: Already configured in the ARGS with --log.level=warn
For Loki: Edit /etc/loki/config.yml and set log level to warn or error
For Grafana: Edit /etc/grafana/grafana.ini and adjust the logging section:
ini
[log]
mode = console file
level = warn
To receive email notifications for critical metrics:
sudo nano /etc/grafana/grafana.ini
ini
[smtp]
   enabled = true
   host = smtp.gmail.com:587
   user = your-email@gmail.com
   password = your-app-password
   from_address = your-email@gmail.com
   from_name = Grafana Unbound
sudo systemctl restart grafana-server
If running on a Raspberry Pi or similar device:
Reduce Scrape Frequency: Edit /etc/prometheus/prometheus.yml and increase scrape_interval:
yaml
global:
  scrape_interval: 10m  # Instead of 5m
Limit Log Collection: Edit /etc/promtail/config.yml and add filters to reduce log volume
Adjust Loki Retention: Edit /etc/loki/config.yml to reduce retention period:
yaml
table_manager:
  retention_deletes_enabled: true
  retention_period: 168h  # 7 days instead of default
Regular backups are essential:
# Create a backup directory
sudo mkdir -p /backup/unbound-dashboard
# Backup Grafana database
sudo cp /var/lib/grafana/grafana.db /backup/unbound-dashboard/# Backup all configurations
sudo cp /etc/grafana/grafana.ini /backup/unbound-dashboard/
sudo cp /etc/prometheus/prometheus.yml /backup/unbound-dashboard/
sudo cp /etc/loki/config.yml /backup/unbound-dashboard/
sudo cp /etc/promtail/config.yml /backup/unbound-dashboard/
sudo cp /etc/unbound/unbound.conf /backup/unbound-dashboard/# Create a tar archive
cd /backup
sudo tar -czf unbound-dashboard-backup-$(date +%Y%m%d).tar.gz unbound-dashboard/
Consider setting up a cron job to automate backups.
The dashboard provides visibility into numerous aspects of your DNS resolver:
The project includes several optimizations:
The Unbound Dashboard represents a comprehensive, efficient, and user-friendly solution for monitoring DNS infrastructure. Whether you’re running Unbound on a Raspberry Pi in your home lab or managing DNS for a small organization, this dashboard provides the insights you need to ensure optimal performance and security.
With its combination of real-time metrics, historical analysis, and log aggregation, the Unbound Dashboard transforms raw DNS data into actionable insights, all presented through Grafana’s elegant interface.
We have detected that you are using extensions to block ads. Please support us by disabling these ads blocker.