
Monitoring and Alerts in VMware vCenter: Complete Guide for vSphere Administrators
Learn how to monitor ESXi hosts, virtual machines, datastores, networks, and vCenter Server health, then configure actionable alarms, email notifications, and SNMP alerts to detect infrastructure problems early.
Monitoring is a core operational responsibility in every VMware vSphere environment. A virtual infrastructure can contain multiple vCenter Server instances, ESXi hosts, clusters, resource pools, datastores, virtual networks, and hundreds of virtual machines. Without a structured monitoring and alerting strategy, an administrator may discover a failed host, exhausted datastore, overloaded virtual machine, or unavailable management service only after users report an outage.
VMware vCenter Server provides centralized visibility into the health and performance of vSphere inventory objects. The vSphere Client includes performance charts, hardware health information, events, triggered alarms, and configurable alarm definitions. Administrators can use these capabilities to identify resource pressure, investigate changes, and notify the right team when a defined condition occurs.
This guide explains the monitoring capabilities available in vCenter, the metrics and events that matter, how to design useful alarms, and how to configure notification methods. The final section is a practical, step-by-step tutorial for building a basic monitoring and alerting configuration in a vCenter-managed environment.
1. Why VMware vCenter Monitoring Matters
Virtualization consolidates workloads onto shared physical infrastructure. This improves utilization and simplifies management, but it also creates dependencies. A single ESXi host failure can affect several virtual machines. A datastore running out of free space can interrupt snapshots, provisioning, and virtual machine operations. Excessive CPU ready time or memory contention can degrade application performance even when a VM appears powered on.
Monitoring provides early visibility into these conditions. Instead of waiting for a complete failure, administrators can use performance trends and threshold-based alarms to identify warning signs and plan corrective action.
Availability
Detect disconnected ESXi hosts, inaccessible datastores, failed services, and powered-off workloads that should be running.
Performance
Identify CPU contention, memory pressure, storage latency, and network bottlenecks before they become widespread incidents.
Capacity planning
Track resource consumption and growth trends to plan compute, memory, and storage expansion.
Operational security
Review important inventory events and administrative activity, and forward relevant notifications to centralized systems.
2. How vCenter Monitoring Works
vCenter collects and presents information about managed vSphere objects. The exact data available depends on the object type, vSphere version, configured statistics level, installed integrations, and permissions assigned to the administrator.
Performance data
Performance statistics describe resource use over time. vCenter performance charts can display metrics for inventory objects such as virtual machines, hosts, clusters, and datastores. These charts help answer questions such as whether CPU demand is increasing, whether memory is under pressure, or whether storage latency is affecting a workload.
Events and tasks
Events record actions or state changes in the environment. Examples include a VM being powered on, a host becoming disconnected, a configuration change, or a user action. Tasks represent operations initiated in vCenter, such as deploying a VM or migrating a workload. They provide operational context when investigating an incident.
Alarms
An alarm definition evaluates a configured event, condition, or state. When its trigger criteria are met, the alarm can change state and perform configured actions. Alarm definitions can be associated with appropriate inventory object types and inherited through the inventory hierarchy, depending on their configuration.
3. What Should You Monitor in VMware vCenter?
A useful monitoring plan covers the complete virtual infrastructure rather than focusing only on virtual machine CPU utilization. The following areas provide a practical starting point.
| Area | What to monitor | Why it matters |
|---|---|---|
| ESXi hosts | Connection state, hardware health, CPU, memory, maintenance state | Detect host failures and resource pressure. |
| Virtual machines | Power state, CPU, memory, guest heartbeat where available, snapshots | Identify unavailable or poorly performing workloads. |
| Datastores | Free capacity, provisioned capacity, latency, accessibility | Prevent capacity exhaustion and storage-related outages. |
| Clusters | Aggregate CPU and memory demand, HA status, DRS activity | Understand cluster-wide capacity and resilience. |
| Networking | NIC status, traffic, packet drops, connectivity and uplink health | Find network degradation and physical link problems. |
| vCenter appliance | Disk partitions, CPU, memory, services, database and log health | Protect the management plane itself. |
| Operations | Events, tasks, user activity, failed operations, configuration changes | Support incident investigation and change tracking. |
3.1 ESXi host monitoring
Monitor host connection state, hardware sensor status, CPU utilization, memory utilization, network adapters, storage adapters, and the health of critical host services. Hardware health information may depend on the server vendor, supported sensors, firmware, and the hardware monitoring provider.
3.2 Virtual machine monitoring
Monitor VM power state, CPU usage, memory activity, virtual disk performance, network traffic, snapshot growth, and guest operating-system signals where VMware Tools and the guest environment provide them. A powered-on VM is not necessarily a healthy application, so application-level checks may also be required.
3.3 Datastore and storage monitoring
Track datastore free space and growth trends, storage latency, IOPS, throughput, path health, and accessibility. Pay special attention to snapshots: a VM snapshot that remains in place and grows over time can consume substantial datastore capacity. Broadcom documents a VM-level alarm based on snapshot size as one way to warn administrators before a datastore fills.
3.4 Network monitoring
Monitor physical NIC state, uplink availability, traffic rates, packet drops, port and distributed switch health, and VM network performance. Correlate vCenter observations with physical switch, firewall, and router telemetry because vCenter cannot replace end-to-end network monitoring.
4. Monitoring Performance Charts in vCenter
Performance charts are useful for examining current resource consumption and historical trends. In the vSphere Client, select an inventory object such as a VM, ESXi host, cluster, or datastore, then open its Monitor area and locate Performance. The exact labels and navigation can vary between vSphere releases and object types.
Common performance counters
Shows processor consumption. Interpret it alongside host CPU demand, CPU ready time, and workload behavior.
Review active, consumed, granted, ballooned, compressed, and swapped memory where the selected object exposes these counters.
Examine read and write latency, throughput, and IOPS to identify storage performance issues.
Review transmit and receive rates, packet activity, and dropped packets where counters are available.
Use multiple time ranges
Use real-time charts when troubleshooting an active incident and historical views when looking for recurring patterns. A short spike may not require intervention, while a sustained trend can indicate a capacity or configuration problem. Compare the same time window across the VM, host, cluster, and datastore to identify where contention begins.
Statistics levels and retention
vCenter statistics levels influence the performance counters collected and the amount of data stored. Do not raise statistics levels indiscriminately. Broadcom warns that higher levels can increase database storage consumption and contribute to vCenter storage pressure in some environments. Choose the lowest level that meets operational and integration requirements, and review retention settings as part of capacity management.
5. Events, Tasks, and Triggered Alarms
Performance charts show how resources behave; events and tasks help explain what happened. When investigating an issue, inspect the selected object’s monitoring views and review the relevant event and task history.
Examples of useful events
- An ESXi host disconnects or reconnects.
- A datastore becomes inaccessible.
- A virtual machine is powered off, reset, or migrated.
- A snapshot is created, removed, or consolidated.
- A configuration or permission change occurs.
- A task fails or completes with an error.
Event records can help establish a timeline: what happened, when it happened, which object was involved, and which user or system initiated the action. Retention settings determine how long historical events and tasks remain available in vCenter. Align retention with troubleshooting, audit, and storage requirements.
Triggered alarms
Triggered alarms show conditions that have moved into warning, alert, or other configured states. Review the alarm definition, trigger condition, affected object, timestamp, and recent events before taking action. Acknowledge an alarm only when the operational process calls for it; acknowledgement does not itself resolve the underlying condition.
6. Understanding vCenter Alarm Definitions
An alarm definition describes what vCenter should monitor and what action it should take when a trigger condition is met. A well-designed alarm has a clear name, a suitable target object type, a measurable condition, an appropriate severity, and an actionable notification.
Explain the condition and affected service in plain language.
Choose the appropriate object type, such as VM, host, datastore, or vCenter Server.
Define event, condition, or state criteria and warning or critical severity.
Choose email, SNMP trap, or another supported action.
Define how the alarm returns to normal and how repeat notifications should behave.
Warning and critical thresholds
Use warning thresholds to give administrators time to investigate, and critical thresholds for conditions that need urgent attention. The correct values depend on workload characteristics, storage design, operational policies, and the capacity available in your environment.
For example, a datastore alarm might use a warning threshold when free capacity falls below a planning buffer and a critical threshold when free capacity approaches the level at which workloads could be affected. These values should be based on growth rate and recovery time, not copied blindly from another environment.
Alarm inheritance and scope
Alarms can be associated with different inventory object types. When you create an alarm at a higher inventory level, understand which child objects it applies to and whether the selected target type supports the trigger you need. Avoid creating duplicate alarms at multiple levels unless there is a deliberate reason.
Avoid alert fatigue
Too many alarms, poorly chosen thresholds, or repeated notifications can cause administrators to ignore important alerts. Start with a small set of high-value alarms, test them, and adjust the rules based on real operational behavior.
7. Email, SNMP, and External Notifications
Monitoring is useful only when important information reaches someone or something that can respond. vCenter alarm actions can be configured to send email notifications and SNMP traps, depending on the alarm type, vCenter version, and configured infrastructure.
Email notifications
Configure the vCenter mail sender settings with the SMTP server details required by your organization. Depending on your mail platform, this may include the SMTP host, port, sender address, authentication, and TLS requirements. Verify connectivity and relay permissions with the mail administrator. Then configure the alarm action with the intended recipient addresses.
SNMP traps
SNMP traps can forward alarm information to a network management system or monitoring platform. Configure the vCenter SNMP receiver settings for the version you run, and ensure the receiver, network path, firewall rules, and SNMP version or credentials are correct. Test trap delivery from a controlled alarm before relying on it for production operations.
External monitoring platforms
Many organizations forward vCenter events and alerts into a central monitoring, logging, or IT service management platform. This can provide correlation across VMware infrastructure, storage arrays, physical networking, backup systems, operating systems, and applications. Use supported integrations and protect API credentials and service accounts.
8. Monitoring the vCenter Server Appliance (VCSA)
vCenter is itself a critical management workload. If the vCenter Server Appliance runs out of disk space or a required service fails, administrators may lose centralized management even while ESXi hosts and virtual machines continue running.
Monitor appliance disk usage
Use the vCenter Server Appliance Management Interface (VAMI) to review appliance health and disk usage. Pay attention to storage partitions used for logs, database data, statistics, and other appliance services. The available views and partition names depend on the vCenter release.
Configure disk exhaustion alarms
Broadcom documents vCenter alarms for appliance disk exhaustion, including log and database-related partitions in applicable versions. Review the built-in alarm definitions and set thresholds appropriate to your environment. The alarm can be configured to send email notifications or SNMP traps when supported.
Monitor statistics and event retention
Statistics collection and event retention affect the amount of data stored by vCenter. Broadcom recommends keeping statistics level at level 1 unless a higher level is required by a third-party product. Excessive statistics collection and unsuitable retention settings can contribute to storage pressure.
Monitor services and appliance health
Review appliance health, service status, backup status, certificate validity, and resource consumption. Use the supported appliance management tools and documented service procedures for your release. Avoid manually deleting files from appliance partitions to recover space; identify the source of growth and follow the vendor-supported remediation path.
9. VMware vCenter Monitoring Best Practices
Prioritize conditions that affect business services, availability, or recovery objectives.
Use environment-specific baselines and sustained conditions where appropriate to avoid transient noise.
Monitor VCSA storage, services, certificates, backups, and access to the vSphere Client.
Validate SMTP, SNMP, and external integrations instead of assuming a configured action is working.
Assign teams or on-call roles to each critical alert category and document escalation.
Use least-privilege accounts, protect credentials, restrict receiver access, and audit changes.
Use historical data and growth rates to plan compute, memory, and storage before exhaustion.
Remove obsolete alarms, adjust noisy thresholds, and test after upgrades or infrastructure changes.
10. Step-by-Step Tutorial: Configure Monitoring and Alerts in VMware vCenter
This practical tutorial creates a basic monitoring configuration using the vSphere Client. It covers checking performance, reviewing events, configuring email settings, and creating an example datastore capacity alarm. The interface and available trigger names can vary by vCenter release, so use the equivalent options shown in your installed version.
Lab scenario
- Platform: VMware vCenter Server managing one or more ESXi hosts.
- Access: vSphere Client account with permissions to view performance data and create or modify alarms.
- Notification: An SMTP relay reachable from vCenter, or an SNMP receiver if using traps.
- Test object: A non-production datastore or other safe inventory object for validating the alarm.
- Goal: Monitor infrastructure health and notify administrators when datastore capacity reaches a defined threshold.
Step 1: Sign in to the vSphere Client
- Open a browser and navigate to your vCenter Server URL, commonly
https://vcenter-fqdn/ui. - Sign in using an account with the required monitoring and alarm-management permissions.
- Open the inventory view and confirm that the expected datacenters, clusters, hosts, virtual machines, and datastores are visible.
- Confirm that the vCenter Server and managed ESXi hosts are connected and not reporting unexpected health issues.
Step 2: Review host and virtual machine performance
- Select an ESXi host from the inventory.
- Open Monitor and locate Performance.
- Review CPU, memory, network, and storage charts available for that host.
- Select a virtual machine and review its CPU, memory, disk, and network performance.
- Change the chart time range to compare real-time activity with historical trends.
- Record normal operating values so that alarm thresholds can be based on your environment rather than arbitrary numbers.
Step 3: Review events and triggered alarms
- Select a host, VM, datastore, or vCenter object.
- Open the Monitor tab.
- Locate the Tasks and Events or equivalent event view for your version.
- Filter the records by time, severity, or event type where available.
- Open a relevant event to inspect its details and identify the affected object and timestamp.
- Review the Issues or Triggered Alarms view to see active alarm states.
Step 4: Configure vCenter email sender settings
Before configuring alarm email actions, set up the mail sender details for vCenter. The menu path differs slightly between releases, but the setting is generally available from the vCenter Server object’s configuration area.
- Select the vCenter Server object in the inventory.
- Open Configure and locate the mail or general settings area for your version.
- Choose Edit for the mail sender settings.
- Enter the SMTP server details provided by your mail administrator, including sender address and any required authentication or TLS settings exposed by the version.
- Save the configuration.
- Confirm that the SMTP relay permits messages from the vCenter appliance and that network/firewall rules allow the required connection.
Step 5: Create a datastore capacity alarm
This example creates an alarm for datastore capacity. The precise trigger labels and supported actions vary by release and datastore object type. Choose the available datastore usage or free-space condition that best matches your vCenter version.
- In the vSphere Client inventory, select the datacenter or datastore object that should be monitored.
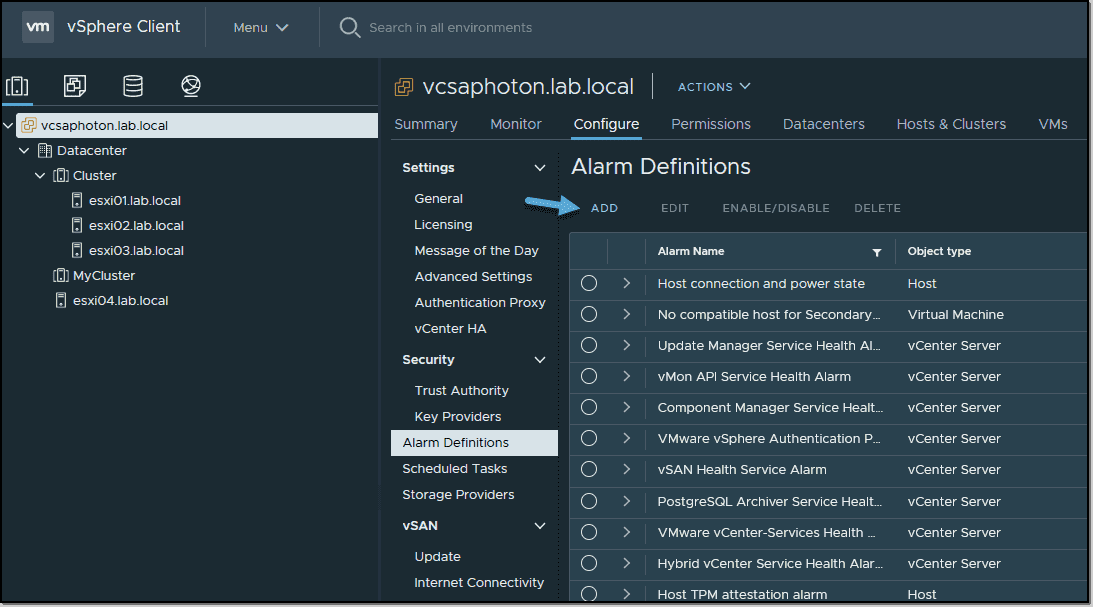
- Open Configure and select Alarm Definitions. In some versions, you can right-click an object and use the Alarms menu.
- Click Add to create a new alarm definition.
- Enter a descriptive name, such as
Datastore Capacity Warning. - Add a description explaining the threshold and the team responsible for responding.
- Choose the appropriate target type, such as Datastore, if that is the target type supported by the selected alarm wizard.
- Configure a warning trigger for the appropriate datastore usage or free-space condition.
- If the wizard supports a second trigger, configure a more severe critical condition.
- Choose the action to send an email notification and enter the operations mailbox address.
- Review the alarm summary, confirm that the alarm is enabled, and click Create.
Step 6: Configure an ESXi host connection alarm
- Select the vCenter Server or the inventory scope where the host alarm should apply.
- Open Configure → Alarm Definitions and select Add.
- Name the alarm
ESXi Host Connection State. - Set the target type to Host if available in the wizard.
- Choose the event or host connection state trigger that detects a disconnected or not responding host.
- Set the severity to warning or critical according to your operational policy.
- Add an email or SNMP action and specify the correct destination.
- Review the definition and create the alarm.
For production use, verify whether the selected trigger detects the host state you intend to monitor. A host that is disconnected from vCenter, a host that is not responding, and a host with hardware health warnings are different conditions and may require separate alarm definitions.
Step 7: Configure an optional VM snapshot size alarm
Large or long-lived VM snapshots can consume datastore capacity. Broadcom documents a VM-level alarm using the VM Snapshot Size trigger in vCenter 7.x and 8.x.
- Select the target virtual machine in the inventory.
- Open the Alarms menu and choose New Alarm Definition.
- Set the target type to Virtual Machine.
- Choose VM Snapshot Size as the trigger, where available.
- Set the operator to is above and enter a threshold in GB based on your workload and datastore capacity.
- Configure the warning severity and notification action.
- Review and create the alarm.
Use this as an early warning, not as an automatic instruction to delete snapshots. Snapshot consolidation and removal should follow the application’s backup and change-management procedures.
Step 8: Configure SNMP traps (optional)
If your organization uses an SNMP monitoring platform, configure the SNMP receiver settings on vCenter using the documentation for your vSphere release.
- Confirm the SNMP receiver address and the supported SNMP version and security settings with your monitoring team.
- Configure the SNMP receiver on vCenter Server.
- Confirm firewall rules and routing allow trap traffic from vCenter to the receiver.
- Edit the alarm definition and enable Send SNMP traps as an action.
- Save the alarm and validate receipt in the monitoring platform.
Do not assume that configuring a receiver automatically enables traps for every alarm. The notification action must also be enabled in the relevant alarm definition.
Step 9: Test and document the alert workflow
- Use a safe test condition or a dedicated test alarm. Avoid deliberately filling a production datastore or disconnecting a production host just to test notifications.
- Confirm that the alarm enters the expected state.
- Verify that the configured mailbox or SNMP receiver receives the notification.
- Check that the notification identifies the affected object and the alarm condition.
- Resolve or reset the test condition and confirm that the alarm returns to green as expected.
- Document the alarm owner, severity, threshold, recipient, and remediation procedure.
- Performance charts are visible for selected hosts and VMs.
- Events and triggered alarms can be reviewed.
- Mail sender settings are configured and delivery has been tested.
- Datastore and host alarms are enabled.
- At least one notification has been received and verified.
- The alert owner and response procedure are documented.
11. Validate and Troubleshoot Alerts
If an alarm changes state but no notification arrives, investigate the complete path from the alarm rule to the destination system.
No email received
Verify SMTP host, port, sender address, authentication, TLS requirements, relay permissions, DNS, routing, and firewall rules. Check the mail server logs for rejected messages.
No SNMP trap received
Confirm the receiver configuration, SNMP version, destination address, network path, firewall rules, and that the alarm action has Send SNMP traps enabled.
Alarm never triggers
Check the target type, trigger condition, threshold units, alarm enablement, object scope, and whether the metric is available for the selected object.
Too many notifications
Review thresholds, severity, repeat behavior, and event frequency. Consolidate duplicate alarms and route informational conditions to dashboards rather than urgent channels.
Alarm triggers only once
Review alarm reporting and repeat-action behavior for your version. vCenter may throttle repeated actions to reduce notification volume.
vCenter storage is growing
Check appliance disk usage, statistics levels, event/task retention, and log growth. Follow Broadcom guidance rather than manually deleting appliance files.
Broadcom documents notification throttling behavior for some vCenter alarm configurations and provides separate guidance for repeating SNMP traps until an alarm is acknowledged or returns to green. Review the applicable knowledge-base article for your exact vCenter version before changing repeat settings.
Conclusion
Monitoring and alerting in VMware vCenter are essential for maintaining a reliable virtual infrastructure. Performance charts help administrators understand resource behavior, events and tasks provide operational history, and alarm definitions turn important conditions into notifications that can be acted upon.
A practical monitoring strategy should cover ESXi hosts, virtual machines, clusters, datastores, networks, and the vCenter Server Appliance itself. Start with high-value alerts for host connectivity, datastore capacity, snapshot growth, hardware health, and critical resource pressure. Configure email or SNMP delivery, test each notification path, and tune thresholds to match the environment.
Most importantly, monitoring is not complete when an alarm is created. It is complete when the right person receives a useful alert, understands its impact, and can follow a documented procedure to resolve the underlying condition.
Official Documentation and References
- Broadcom KB 318930 — Monitor and prevent vCenter Appliance disks from filling
- Broadcom KB 375439 — Create a VM snapshot size alarm
- Broadcom KB 428536 — Configuring SNMP traps for vCenter Server user login events
- Broadcom KB 425412 — Repeat SNMP traps until acknowledged or reset
- Broadcom KB 324327 — Email alerts and SNMP traps not sent for repeat trigger conditions
- Broadcom TechDocs — VMware vSphere documentation
Menu labels, available alarm triggers, notification options, and appliance views vary by vCenter/vSphere release. This tutorial describes the general vSphere Client workflow. Verify each procedure against the documentation for the exact version deployed in your environment.