
Introduction
Performance monitoring in VMware ESXi 8 is a crucial skill for every virtualization administrator. Whether you’re managing a single host or a cluster, understanding how to measure and interpret performance metrics will help you maintain a healthy and optimized environment. In this blog post we well learn the essentials of monitoring performance metrics in VMware ESXi 8.
Why Monitoring Performance Metrics Matters
Monitoring performance metrics in VMware ESXi 8 is crucial for maintaining an efficient, reliable, and scalable virtualized environment. By tracking resource utilization across CPU, memory, disk, and network, you can ensure optimal performance and prevent resource contention or underutilization. It also enables early detection and resolution of performance bottlenecks, such as high disk latency or network errors, minimizing downtime and disruptions. Proactive tools like vSphere and vRealize Operations provide alerts that help maintain system health and ensure compliance with Service Level Agreements (SLAs).
Additionally, monitoring supports capacity planning and cost efficiency by helping predict future resource needs and avoiding unnecessary hardware upgrades. It also improves troubleshooting accuracy by providing actionable insights into performance issues. Overall, consistent monitoring ensures your infrastructure remains healthy, scalable, and capable of adapting to evolving workloads and business needs.
Key Metrics to Monitor in VMware ESXi 8
Monitoring key performance metrics in VMware ESXi 8 ensures your virtualized environment remains efficient and responsive. Here’s a breakdown of the main metrics to track:
CPU Metrics
- Usage: Measures the percentage of CPU actively utilized by the VM or host.
- Ready Time: Tracks the time a VM waits for CPU access. High ready time often indicates CPU contention.
- Co-stop: Relevant for multi-vCPU VMs, this metric measures synchronization overhead between vCPUs, signaling inefficiencies in resource allocation.
Memory Metrics
- Active Memory: Indicates the memory actively consumed by the VM, providing insight into resource demand.
- Ballooning: Tracks memory reclamation. Frequent ballooning often points to memory overcommitment issues.
- Swap Usage: Monitors the use of disk swapping, as excessive swapping can drastically impact performance.
Disk (Storage) Metrics
- I/O Latency: Measures read/write delays. High latency suggests storage bottlenecks.
- Throughput: Tracks data transfer rates (MB/s), providing an overview of storage performance.
- Disk Queue Length: Shows the number of I/O operations waiting for processing, indicating potential storage congestion.
Network Metrics
- Packets Dropped: Highlights packet loss due to network issues, affecting application performance.
- Throughput: Measures incoming and outgoing network traffic in Mbps, indicating overall network activity.
- Error Rates: Monitors errors caused by misconfigurations, faulty hardware, or connectivity issues.
Tools for Monitoring Performance Metrics in VMware ESXi 8
VMware ESXi offers several built-in tools for performance monitoring:
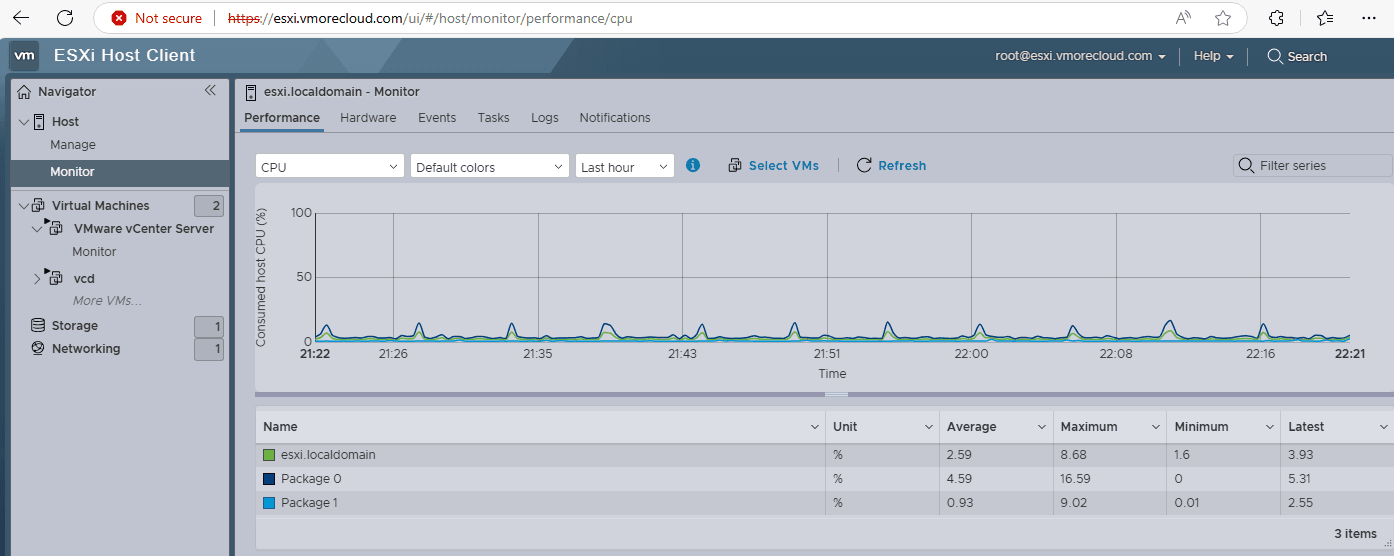
vSphere Client Performance Tab
Provides detailed charts for CPU, memory, disk, and network usage.
Navigate to Host > Monitor > Performance to view real-time and historical metrics.

esxtop Command
Run directly on the ESXi host for real-time performance analysis.
Launch putty and ssh to login into the ESXi shell and typing esxtop.
- Use interactive options like:
c: CPU metricsm: Memory metricsd: Disk metricsn: Network metrics
- vRealize Operations Manager (vROps)
- Ideal for large environments, offering advanced analytics and AI-driven insights.
Step-by-Step: Using esxtop to Monitor Metrics
Step 1: Access the ESXi Shell
Enable SSH on your ESXi host using the vSphere Client.
Log in using an SSH client like PuTTY.
Step 2: Launch esxtop
Type esxtop and press Enter.The default screen shows CPU metrics.
Step 3: Switch to Other Metrics
Press m for memory metrics.
Press d for disk metrics.Press n for network metrics.
Step 4: Customize the Display
Press f to view fields you can toggle.
Select or deselect fields to focus on metrics relevant to your environment.
Best Practices for Monitoring ESXi Performance
Set Baselines
Establishing performance baselines is crucial for identifying anomalies. Record normal performance metrics during typical workloads to create a reference point. This helps you quickly detect when something deviates from expected behavior.
Use Alarms
Leverage vSphere alarms to stay proactive. Configure alerts to notify you of resource contention, unusual activity, or other critical events, enabling swift action before issues escalate.
Monitor Regularly
Make it a habit to review performance data periodically. Regular monitoring allows you to detect trends, identify bottlenecks, and address issues early, preventing potential disruptions.
Plan for Growth
Utilize historical performance data for effective capacity planning. This helps allocate resources efficiently and ensures your infrastructure can accommodate future workload demands.
Update Regularly
Keep your ESXi hosts updated with the latest patches and updates. Regular updates not only improve performance but also enhance security, ensuring your environment remains optimized and protected.
By following these best practices, you can maintain a healthy and efficient ESXi environment, ensuring optimal performance and long-term scalability.
Common Performance Issues and How to Resolve Them
| Issue | Cause | Solution |
|---|---|---|
| High CPU Ready Time | Overcommitted CPUs | Reduce vCPU allocation or add physical CPUs. |
| High Memory Ballooning | Overcommitted memory | Add more physical RAM or reduce VM memory. |
| High Disk Latency | Slow storage or I/O bottleneck | Upgrade storage or optimize disk usage. |
| Network Packet Drops | Insufficient bandwidth or misconfigurations | Add network bandwidth or troubleshoot NICs. |
Conclusion
Monitoring performance metrics in VMware ESXi 8 is essential for maintaining a stable and efficient virtualization environment. By leveraging tools like the vSphere Client and esxtop, along with following best practices, you can proactively manage resources, resolve performance issues, and ensure an optimal experience for users and applications.
- Design